![]()
PART I
Trading success is heavily dependent upon being on the right side of the trade and executing the trade at a reasonably optimal time. Neither concept is new. Both are much more difficult to do than they seem.
Take a moment to consider the implications of these two thoughts. What does it mean to be on the right side of a trade? For a technical trader, this almost always means that you are trading with the trend, but even that statement is somewhat ambiguous since it implies that the definition of a trend is known and that there is only one trend. Unless you read my first book, Trend Qualification and Trading,1 you are probably unaware that not all trends are created equal and you are unlikely to have a keen appreciation for the fact that there are necessarily multiple trends spread across many time frames that exist simultaneously. What is more, trends across multiple time frames are not necessarily the same. In fact, they differ more often than not. As you can see, once you dig into the concepts a bit, the mental clarity of the high level thoughts quickly becomes murky.
For this reason, before jumping headfirst into a detailed consideration of how to find the highest probability trades, a preliminary discussion of some basic concepts is necessary. Hopefully this will simply be a refresher. Without a common and somewhat precise understanding of the terminology used throughout this book, much of the value will fall upon deaf ears. For that reason, Part I tackles the thorny question of trend and time frames as well as entry and exit timing. It is necessarily covered with reasonably broad brushstrokes yet with sufficient color to elucidate the general principles of qualified trend and anchored support and resistance. In this way, when I speak of a concept such as a suspect bullish qualified trend on the short term time frame, you will understand with exactness both the term and the implications.
Although the material is a review of prior concepts, it is by no means limited to dry definitions regurgitated at a pace that would make a snail appear to be a speed demon. Rather than bore readers of my prior work with three chapters that beg them to skim if not skip, I have instead added significant data to validate the assertion that all trends are not created equal. A distinction is made between trend and trade failures and some simplistic trading rules are implemented to show how timing of entry and exit can yield better trading results through the use of anchored zones.
The third chapter utilizes the Trading Cube to illustrate the broader influences that directly affect trade success and failure. Again empirical data is presented that strongly supports the idea that trading with the trend where that trend is confluent for the stock, the sector, and the general market for the time frame being traded is the most desirable trade set-up. Unfortunately, the market seldom makes it that simple.
The result of the first three chapters is much more than an overview of the basic concepts that comprise the neoclassical concepts of trend trading. Each chapter houses additional and previously unpublished data regarding trend and offers insight into how a trader can benefit from the knowledge. More importantly, these first three chapters lay the groundwork for what follows—finding and executing the best trade set-ups.
The concepts first presented in Trend Qualification and Trading are reinforced through real data and presented in a easily understandable manner. There are no fancy formulas, mathematical complexities, or unneeded mental fog. Trading need not be a theoretical formulation of complex and somewhat indecipherable thought. It does not have to depend on models so complex that the originator of the model must muddle through notes when trying to explain it. Elegance is typically hidden in simplicity, and neoclassical trend trading is just that. Like a fine wine it is beautifully simple yet complete and it only improves with time and practice!
1 L.A. Little, Trend Qualification and Trading (Hoboken, NJ: John Wiley & Sons, 2011).
![]()
CHAPTER 1
Identifying and Qualifying Trend Probabilities
Historically, trend was generally defined as a series of higher highs and higher lows (bullish trend) or a series of lower highs and lower lows (bearish trend). This general definition took hold at the turn of the twentieth century and, for the most part, has held sway ever since.
In Trend Qualification and Trading,1 a more precise and valuable definition of trend was proposed. It suggested the idea that significant price points could be systematically determined on a chart and that these price points would typically end up being at price extremes. These price extremes would have significance because any subsequent test of the price point would provide a comparison. Essentially, the volume on the prior price extreme could be compared to volume on the current price test. This comparison yields insight into the enthusiasm and conviction of the buyers and sellers. If market participants are willing to buy an increasing number of shares at new price extremes, then, for whatever reason, the buyers are expressing their belief that prices will go even higher. The same is true of sellers selling an increasing number of shares at lower and lower price extremes. By measuring this outward expression of conviction, the true equation of the supply and demand of the stock can be made and it is made at the price point where it matters, which typically is at price extremes.
This fundamental approach to a stock's supply and demand characteristics enables observers to gain a far better understanding of the true trend because trend transitions are necessarily determined at price boundaries. It allows one to qualify a trend, and that is important because with trend qualification, all trends are no longer viewed as equals. Some trends are better than others. A quick summary of how to determine trend follows.
TREND DETERMINATION
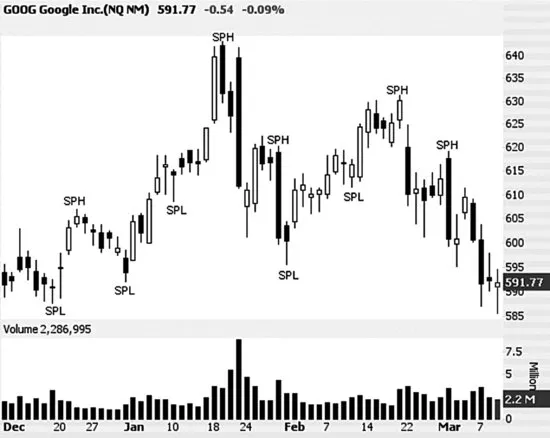
Figure 1.1 is a short-term annotated chart of Google. The annotations highlight each bar on the chart where a swing point high (SPH) or swing point low (SPL) is observed.
Swing point highs and lows are the result of a simple and methodical calculation. Starting at the leftmost bar on the chart, the high and low of the bar are noted. This high is the potential swing point high while the low is the potential swing point low. Next, the adjacent bar to the right is examined, and if the high is higher than the previous bar's high, this higher high becomes the potential swing point high. Likewise, the same operation is completed for the low. When six adjacent bars have been examined without a higher high having been found, then the potential swing point high becomes actualized and the high of the sixth bar is the new potential swing point high going forward. The same is true of lows. In this way, swing point highs and lows are consistently determinable, and the vast majority of these highs and lows end up signifying turning points and/or price extremes on the chart for the time frame under observation. In those cases where they do not, many times value is still produced when it comes to trend determination. In rare cases, they have little value.
With any systematic application of set and sometimes rigid rules, there are times where the price points line up in such a way that a glance at a chart intuitively suggests an up or down trend, yet the rules used to determine swing points fail to make the same determination. While six bars have been found to be optimal, this system is by no means perfect. There are times where a set of human eyes must recognize the deficiency and account for it accordingly in trading. In the vast majority of the cases, the rules outlined work extremely well and the advantages gained from a rigid set of rules when determining trend far outweigh the occasional misreads. In particular, when rigid rules are utilized they can be computer automated. In this way, the systematic and algorithmic trend determination process associated with the neoclassical trend model has significant and immeasurable advantages to the classical trend model it has replaced.
Once swing point highs and lows are determined, then trend can likewise be ascertained. Historically, trend took the form of three states: bullish, bearish, and sideways. In the neoclassical trend model of trend qualification, there are a total of seven states. Suspect and confirmed qualifiers are attached to each of the bullish, bearish, and sideways states and one additional ambivalent sideways state is introduced. For the six bullish, bearish, and sideways qualified states, trend transitions occur as t...