![]()
PART I
An Overview
![]()
Chapter 1
A Primer on Chart Setups
This is a book about chart setups and how they can make you a more profitable trader. I have been involved in trading for a quarter-century, and during almost that entire time, I have used charts and technical analysis as the basis of my investing decisions. This book endeavors to show you meaningful, clear examples of the most powerful chart patterns so that you can commit them, and their importance, to memory.
Technical analysis is the study of past price movement for the purpose of predicting future price movement, which, if done correctly, can lead to substantial trading profits. The prices studied are typically those of financial instruments such as stocks, commodities, and foreign currencies. But no matter what market is being studied, the underlying principles are the same. Specifically:
- A price chart is the most perfect representation of the balance of buyers and sellers for any given entity.
- Prices tend to move in trends and patterns which, based on historical analysis, can lead to statistically meaningful probabilities of future price movement.
- The skilled examination of a price chart can guide a trader as to how long he should remain in a trade and when he should exit.
No matter what you trade, technical analysis can make you a better and more profitable trader. Price charts will consistently provide the most truthful picture that can be had of a tradable object, because everything that can be publicly known or speculated is already built into the graph. You will never get the same pure representation of a stock (or anything else) from a broker, a newsletter writer, or an analyst. A chart is as good as it gets. How much good that chart can do for you depends on your own skill and objective analysis.
THE BULLS VERSUS THE BEARS
Before we get into price charts—and there will be hundreds of them in this book—let's examine the basics about what forms a price chart in the first place: sellers (the supply) and buyers (the demand). It should also be noted at the outset that almost all the examples in this book will be of stocks, but the same rules and methods are appropriate for any form of financial instrument.
When buyers are more powerful than sellers, prices move up. When sellers are more powerful than buyers, prices move down. This tug-of-war, in these simple terms, is behind the trillions of dollars that get traded every week of the year. Buying power represents an excess of demand which will, because of simple market dynamics, inflate price levels.
What many people tend to forget is that every time a trade is placed, each side believes that they are right and the other side of the transaction is wrong. When person A buys stock from person B, person A believes the stock is going to go up in price (meaning B is selling too cheap) and person B believes he would rather have the cash than the stock (meaning A is buying an overvalued, or at least fully valued, stock).
As a group, the individuals who believe a given instrument is going to move higher in price are the bulls, whereas the opposing camp, believing prices for the same instrument will drop, are the bears. And the war between the bulls and the bears, fought over many thousands of different stocks, options, and commodities every day, is what creates price movement. Analyzing that movement with skill is what will give you a substantial edge in the markets you trade.
This book seeks not so much to interpret what those wiggles of movement mean. Instead, it seeks to illustrate for you, with example after real-life example, how these patterns as a whole have played out in actual trading. History tends to repeat itself, and recognizing the meaning of a well-formed pattern will be a great ally in your trading career.
WHY IS A PREDICTION VALUABLE?
The astonishing thing about technical analysis is not only how far out its predictive power goes, but also how, even with a future full of unknowns, it still seems able to see its way clear to make a meaningful prediction. A staggering number of great forces can wreak havoc with financial markets—scandals, war, governmental chaos, interest rates, terrorist attacks, earnings surprises, the social climate, financial meltdowns, and so forth. Through it all, the knowledgeable chartist can see what others cannot see and know what seems unknowable.
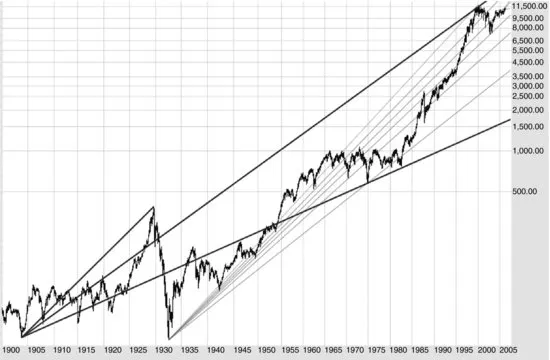
Let's take a real-life example with a very long timespan: the Dow Jones Industrial Average over a period of more than a century. Figure 1.1 has two Fibonacci fans drawn on it (don't worry if you are not familiar with that term; it is explained later in this book). These fans are drawn from an extreme low to an extreme high. The first is drawn from the low in 1903 (called the Rich Man's Panic) to the peak of the Roaring Twenties bull market in 1929. The second is drawn from the depths of the depression in 1932 to the peak of the Internet bubble in January 2000.
There is a variety of astounding things to note in this chart:
- The point where the two major lines intersect in 1974 predicted the precise bottom of the massive 1973–1974 bear market.
- The steady climb from 1990 to 1995 was perfectly bounded by two of the fan lines.
- Most impressive of all, the ultimate market top in 2000 was established by the first fan (which, remember, began 97 years before).
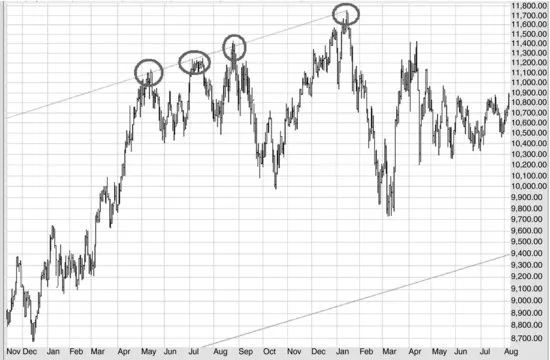
Figure 1.2 is a close-up view of late 1999 and early 2000; as you can see, the almost century-old fan line creates impressive resistance to these prices moving higher on four different occasions. If we owned stocks at that time, this would be a vital warning signal that the top was established.
This is an extreme example, but the point is that being able to gain insight into the most likely future of a particular price is a vehicle for real trading profits. It is an edge that those not using charts lack.
A WORD ON SHORTING
There are many places in this book where we refer to shorting a particular stock or being short a stock. It is valuable to understand this terminology, in case you do not already. I also have a personal fondness for shorting stocks, so there will be more examples of short setups in this book than you might expect.
Most people participating in a market are long the market; that is, they own the security with the hope that the price will go up. So if a person owns 1,000 shares of Apple Computer (AAPL) which he bought at $250 per share, and later sells it for $290 per share, he has made $40,000 based on the long position (a $40 per share gain times 1,000 shares).
A person who is short a security has done things backwards: He first sells a security he does not own for a certain price with the hope that the price will go down. The reason people are able to sell stock they do not own (essentially giving them a negative number of shares) is that their broker has so much of the stock already that it is available to sell with the promise that, at some point, it will be repurchased to replace the shares that were sold.
Taking the example of Apple again, an individual might sell short 1,000 shares of Apple at $290 per share. If the stock fell to $250 and the trader covered the position (that is, bought 1,000 shares of the stock, thus making the broker whole), he would have made $40,000 just as the other trader did, only he would have done it in the other direction.
The advantages and disadvantages of shorting markets will be discussed in a special section later in this book, but the principal benefit of shorting is that you can take advantage of a falling market as well as a rising one. If you are at the beginning of a bear market, and you can only buy stocks, it will be very difficult to make money (inverse ETFs and put options notwithstanding). If you are able to short stocks at high prices and then buy them back later at low prices, you can make money in either an up or down market.
The key disadvantage to shorting stocks is that all the big money is made by going long. The most you can ever make with a short position is 100 percent (that is, if the stock goes to $0.00, which almost never happens), whereas the most you can make with a long position is unlimited. You can definitely make profits shorting markets, but unless you are a brilliant options trader, you will never get rich being a bear (that is, a person betting on a market going down).
SUPPORT AND RESISTANCE
The world of technical analysis can seem overwhelming to many. There are hundreds of complex mathematical indicators, studies, patterns, and rules. But there is absolutely no reason good charting has to be complicated. A trader can set aside all of the complexity and focus on some solid basics, starting with the ideas of support and resistance.
You will find the themes of support and resistance to be the backbones (almost literally) of every single setup in this volume.
To illustrate this, think back to the classic playground-based children's game Red Rover. In case you don't remember it, kids split up into two groups, and each group forms a line by holding hands, so that there are two parallel lines of children facing each other across a field. Then one team calls out, “Red Rover, Red Rover, send Skylar (or some other kid's name) right over!” and the named child rushes headlong into the other line, trying to break through. If she busts through the line, she gets to choose a person to join her team.
This image of breaking through is exactly what support and resistance are all about, because in the grown-up world of trading, buyers of securities tend to mass at certain price levels. And those owners will hold the line at those prices if the security tries to go above (in the case of resistance) or below (in the case of support).
Let's take a simple, hypothetical example. Suppose a given stock traded at between $4.95 and $5.05 for many months. Day after day, week after week, it stayed in this range, accumulating owners of the stock at around the $5 level. Let's go on to assume the company has some good news, and the stock goes up to $6, but subsequent profit-taking pushes the stock back down again.
Given this circumstance, you can rest assured that it's unlikely the stock is going to drop beneath the $5 level. The reason is that there's a huge number of owners at that level, and they are simply not going to sell. Fear and greed are the primary drivers of any market, and in this case, greed is going to come first (meaning the owners are telling the market “I refuse to sell my stock at this price for a breakeven trade; I want a profit”). If something remarkable happens and it shoves the stock down to, say, $4.50, the fear starts to t...