Although there are a number of books in this field, most of them lack an introduction of comprehensive analysis of MS and IR spectra, and others do not provide up-to-date information like tandem MS. This book fills the gap. The merit of this book is that the author will not only introduce knowledge for analyzing nuclear magnetic resonance spectra including 1H spectra (Chapter 1), 13C spectra (Chapter 2) and 2D NMR spectra (Chapter 3), he also arms readers systemically with knowledge of Mass spectra (including EI MS spectra and MS spectra by using soft ionizations) (Chapter 4) and IR spectra (Chapter 5). In each chapter the author presents very practical application skills by providing various challenging examples. The last chapter (Chapter 6) provides the strategy, skills and methods on how to identify an unknown compound through a combination of spectra. Based on nearly 40 years researching and teaching experience, the author also proposes some original and creative ideas, which are very practical for spectral interpretation.
Trusted by 375,005 students
Access to over 1.5 million titles for a fair monthly price.
As described in the preface to this book, the NMR is the most important method to identify the structure of an unknown organic compound, because the information obtained from (one dimensional and two dimensional) NMR spectra is more abundant and interpretable than that obtained by other spectroscopic methods. Since
NMR spectra have higher sensibility than other NMR spectra,
NMR spectra can be acquired more easily in some ways, and we present
NMR spectra in the first chapter of this book.
Because the
NMR spectrum can be interpreted in detail, it is possible to deduce the structure of an unknown compound, whose structure is not complex, only by using its
NMR spectrum,
NMR spectrum and the information about its molecular weight (without two dimensional NMR spectra). When we need to select the most reasonable structure from several possible structures, the
NMR spectrum of that compound can play a very important role.
Even when two dimensional NMR spectra were applied, the information, especially that from the analysis of coupled splittings in the
NMR spectrum, would still be useful to deduce an unknown structure.
The main parameters of
NMR spectra are chemical shifts, coupled constants (and splitting patterns) and peak areas. If we consider a
NMR spectrum from the viewpoint of physics, there is a fourth parameter, that is, relaxation times. However, relaxation times are short for
NMR spectroscopy. Therefore, the variation of relaxation times does not produce variations of peak areas of
NMR spectra. And relaxation times do not affect the interpretation of
NMR spectra.
The abscissa of the
NMR spectrum is the chemical shift δ, which characterizes the position in a
NMR spectrum of the peak of a functional group.
Because of coupling interactions between magnetic nuclei, peaks in the
NMR spectrum will show splittings. The splitting distance between two related split peaks is characterized by the coupling constant, measured in hertz. The magnitude of coupling constants reflects the strength of coupling interaction.
The related knowledge about the chemical shift and the coupling constant will be presented later.
The ordinate of the
NMR spectrum is the intensity of peaks. Because peaks in the
NMR spectrum have some widths, integral values of peak areas are applied as the measurements of intensities of peaks. Integral values, denoted under or beside the corresponding peaks, are proportional to the numbers of hydrogen atoms of related functional groups. The quantitative relationship of the
NMR spectrum is good with errors less than 5%.
The quantitative relationship between the integral values of peak areas and the numbers of hydrogen atoms of corresponding functional groups is important for deducing an unknown structure.
If a measured sample is a mixture, the quantitative ratio of components can be obtained from the quantitative relationship.
By using the quantitative relationship in
NMR spectroscopy, some important results can be obtained. For example, the averaged additional number of ethylene oxides, n, in a non-ionic surfactant, RO(CH2)nH, can be measured easily by using
NMR spectroscopy when we analyze this kind of surfactant. And the averaged value of n is more important than individual numbers which participate in average calculation for evaluating the character of this kind of surfactant. Otherwise, if we apply thin layer chromatography to analyze the surfactant, after its development by thin layer chromatography, we will get a series of spots on the thin plate. Each spot corresponds to a particular additional number and all numbers form a normal distribution shape. In this case, an average number is more important than these individual numbers which participate in average calculation.
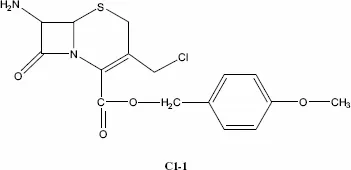
The
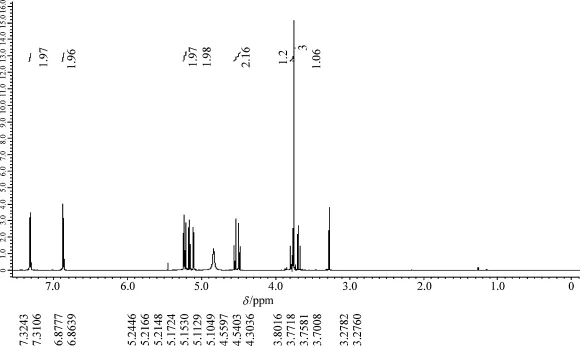
spectrum of Compound C1-1 is shown in Figure 1.1.
Figure 1.1 The
spectrum of compound C1-1
From Figure 1.1 we know that the abscissa of the
spectrum is the chemical shift whose accurate values are denoted under (or above) corresponding peak sets. The ordinate of the
spectrum is the peak intensity. The integral values which show the areas of peak sets are denoted above (or under) corresponding peak sets.
There are split peak sets in the
spectrum. Because split distances are measured in Hz, the higher the frequency of the NMR spectrometer, the shorter the split dist...
Table of contents
Cover
Title Page
Copyright
Foreword
Preface
Chapter 1: Interpretation of 1H NMR spectra
Chapter 2: Interpretation of 13C NMR spectra
Chapter 3: Interpretation of 2D NMR spectra
Chapter 4: Interpretation of mass spectra
Chapter 5: Interpretation of infrared spectra
Chapter 6: Identification of unknown compounds or confirmation of structures through comprehensive interpretation of spectra
List of abbreviations
Index
Frequently asked questions
Yes, you can cancel anytime from the Subscription tab in your account settings on the Perlego website. Your subscription will stay active until the end of your current billing period. Learn how to cancel your subscription
No, books cannot be downloaded as external files, such as PDFs, for use outside of Perlego. However, you can download books within the Perlego app for offline reading on mobile or tablet. Learn how to download books offline
Perlego offers two plans: Essential and Complete
Essential is ideal for learners and professionals who enjoy exploring a wide range of subjects. Access the Essential Library with 800,000+ trusted titles and best-sellers across business, personal growth, and the humanities. Includes unlimited reading time and Standard Read Aloud voice.
Complete: Perfect for advanced learners and researchers needing full, unrestricted access. Unlock 1.5M+ books across hundreds of subjects, including academic and specialized titles. The Complete Plan also includes advanced features like Premium Read Aloud and Research Assistant.
Both plans are available with monthly, semester, or annual billing cycles.
We are an online textbook subscription service, where you can get access to an entire online library for less than the price of a single book per month. With over 1.5 million books across 990+ topics, we’ve got you covered! Learn about our mission
Look out for the read-aloud symbol on your next book to see if you can listen to it. The read-aloud tool reads text aloud for you, highlighting the text as it is being read. You can pause it, speed it up and slow it down. Learn more about Read Aloud
Yes! You can use the Perlego app on both iOS and Android devices to read anytime, anywhere — even offline. Perfect for commutes or when you’re on the go. Please note we cannot support devices running on iOS 13 and Android 7 or earlier. Learn more about using the app
Yes, you can access Interpretation of Organic Spectra by Yong-Cheng Ning in PDF and/or ePUB format, as well as other popular books in Physical Sciences & Spectroscopy & Spectrum Analysis. We have over 1.5 million books available in our catalogue for you to explore.