![]()
CHAPTER 1
Survey Error Evaluation
1.1 SURVEY ERROR
1.1.1 An Overview of Surveys
This book focuses primarily on the errors in data collected in sample surveys and how to evaluate them. A natural place to start is to define the term “survey.” The American Statistical Association’s Section on Survey Research Methods has produced a series of 10 short pamphlets under the rubric What Is a Survey? (Scheuren 1999). That series defines a survey as a method of gathering information from a sample of objects (or units) that constitute a population. Typically, a survey involves a questionnaire of some type that is completed by either an informant (referred to as the respondent), an interviewer, an observer, or other agent acting on behalf of the survey organization or sponsor. The population of units can be individuals such as householders, teachers, physicians, or laborers or other entities such as businesses, schools, farms, or institutions. In some cases, the units can even be events such as hospitalizations, accidents, investigations, or incarcerations. Essentially any object of interest can form the population.
In a broad sense, surveys also include censuses because the primary distinction is just the fraction of the sample to be surveyed. A survey is confined to only a sample or subset of the population. Usually, only a small fraction of the population members is selected for the sample. In a census, every unit in the population is selected. Therefore, much of what we say about surveys also applies to censuses.
If the survey sample is selected randomly (i.e., by a probability mechanism giving known, nonzero probabilities of selection to each population member), valid statistical statements regarding the parameters of the population can be made. For example, suppose that a government agency wants to estimate the proportion of 2-year-old children in the country that has been vaccinated against infectious diseases (polio, diphtheria, etc.). A randomly selected sample of 1000 children in this age group is drawn and their caregivers are interviewed. From these data, it is possible to determine the proportion of children who are vaccinated within some specified margin of error for the estimate. Sampling theory [see, e.g., Cochran (1977) or more recently, Levy and Lemeshow (2008)] provides specific methods for estimating margins of error and testing hypotheses about the population parameters.
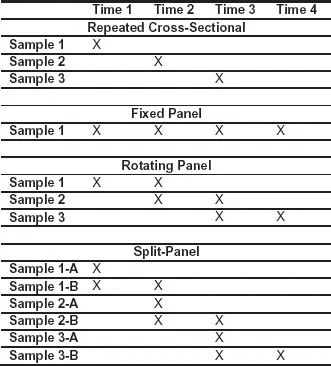
Surveys may be cross-sectional or longitudinal. Cross-sectional surveys provide a “snapshot” of the population at one point in time. The products of cross-sectional surveys are typically descriptive statistics that capture distributions of the population for characteristics of interest, including health, education criminal justice, economics, and environmental variables. Cross-sectional surveys may occur only once or may be repeated at some regular interval (e.g., annually). As an example, the National Heath Interview Survey (Centers for Disease Control and Prevention 2009) is conducted monthly and collects important data on the health characteristics of the US population.
Longitudinal or panel surveys are repeating surveys where at least some of the same sample units are interviewed at different points in time. By taking similar measurements on the same units at different points in time, investigators can more precisely estimated changes in population parameters as well as individual characteristics. A fixed panel (or cohort) survey interviews the entire sample repeatedly usually over some significant period of time such as 2 or more years. As an example, the Panel Study of Income Dynamics (Hill 1991) has been collecting income data on the same 4800 families (as well as families spawned from these) since 1968.
A rotating panel survey is a type of longitudinal survey where part of the sample is replaced at regular intervals while the remainder of the sample is carried forward for additional interviewing. This design retains many of the advantages of a fixed panel design for estimating change while reducing the burden and possible conditioning effects on sample units caused by repeatedly interviewing them many times. An example is the US Current Population Survey (CPS) (US Census Bureau 2006), which is a monthly household survey for measuring the month-to-month and year-to-year changes in labor force participation rates. The CPS uses a somewhat complex rotating panel design, where each month about one-eighth of the sample is replaced by new households. In this way, households are interviewed a maximum of 8 times before they are rotated out of the sample.
Finally, a split-panel survey is a type of longitudinal survey that combines the features of a repeated cross-sectional survey with a fixed panel survey design. The sample is divided into two subsamples: one that is treated as a repeated cross-sectional survey and the other that follows a rotating panel design. An example of a split-sample design is the American National Election Studies [American National Election Studies (ANES), 2008]. Figure 1.1 compares these four survey designs.
As this book will explain, methods for evaluating the error in surveys may differ depending on the type of survey. Many of the methods discussed can be applied to any survey while others are appropriate only for longitudinal surveys. The next section provides some background on the problem of survey error and its effects on survey quality.
1.1.2 Survey Quality and Accuracy and Total Survey Error
The terms survey quality, survey data quality, accuracy, bias, variance, total survey error, measurement validity, and reliability are encountered quite often in the survey error literature. Unfortunately, their definitions are often unspecified or inconsistent from study to study, which has led to some confusion in the field. In this section, we provide definitions of these terms that are reasonably consistent with conventional use, beginning with perhaps the most ambiguous term: survey quality.
Because of its subjective nature, survey quality is a vague concept. To some data producers, survey quality might mean data quality: large sample size, a high response rate, error-free responses, and very little missing data. Statisticians, in particular, might rate such a survey highly on some quality scale. Data users, on the other hand, might still complain that the data were not timely or accessible, that the documentation of the data files is confusing and incomplete, or that the questionnaire omitted many relevant areas of inquiry that are essential for research in their chosen field. From the user’s perspective, the survey exhibits very poor quality.
These different points of view suggest that survey quality is a very complex, multidimensional concept. Juran and Gryna (1980) proposed a simple definition of quality that can be appropriately applied to surveys, namely, the quality of a product is its “fitness for use.” But, as Juran and Gryna explain, this definition is deceptively simple because there are really two facets of quality: (1) freedom from deficiencies and (2) responsiveness to customers’ needs. For survey work, facet 1 might be translated as error-free data, data accuracy, or high data quality, while facet 2 might be translated as providing product features that result in high user satisfaction. The latter might include data accessibility and clarity, timely data delivery, collection of relevant information, and use of coherent and conventional concepts.
When applied to statistical products, the definition “fitness for use” has another limitation in that it implies a single use or purpose. Surveys are usually designed for multiple objectives among many data users. A variable in a survey may be used in many different ways, depending on the goals of the data analyst. For some uses, timeliness may be paramount. For other uses, timeliness is desirable, but comparability (i.e., ensuring that the results can be compared unambiguously to prior data releases from the same survey) may be more critical.
In the mid-1970s, a few government statistical offices began to develop definitions for survey quality that explicitly took into account the multidimensionality of the concept [see, e.g., Lyberg et al. (1977) or, more recently, Fellegi (1996)]. This set of definitions has been referred to as a survey quality framework. As an example, the quality framework used by Statistics Canada includes these seven quality dimensions: relevance, accuracy, timeliness, accessibility, interpretability, comparability, and coherence. Formal and accepted definitions of these concepts can be found at Statistics Canada (2006). Eurostat has also adopted a similar quality framework [see, e.g., Eurostat (2003)].
Given this multidimensional conceptulization of quality, a natural question is quality to be maximized in a survey? One might conceptualize a one-dimensional indicator that combines these seven dimensions into an overall survey quality indicator. Then the indicator could be evaluated for various designs and the survey design maximizing this quantity could be selected. However, this approach oversimplifies the complexity of the problem since there is no appropriate way for combining the diverse dimensions of survey quality. Rather, quality reports or quality declarations providing information on each dimension have been used to summarize survey quality. A quality report might include a description of the strengths and weaknesses of a survey organized by quality dimension, with emphasis on sampling errors, nonsam-pling errors,1 key release dates for user data files, forms of dissemination, availability, and contents of documentation, as well as special features of the survey approach that may be of importance to most users. A number of surveys have produced extended versions of such reports, called quality profiles. A quality profile is a document that provides a comprehensive picture of the quality of a survey, addressing each potential source of error. Quality profiles have been developed for a number of US surveys, including the Current Population Survey (CPS) (Brooks and Bailar 1978), the Survey of Income and Program Participation (Jabine et al. 1990), US Schools and Staffing Survey (Kalton et al. 2000), American Housing Survey (Chakrabarty and Torres 1996), and the US Residential Energy Consumption Survey (Energy Information Administration 1996). Kasprzyk and Kalton (2001) review the use of quality profiles in US statistical agencies and discuss their strengths and weaknesses for survey improvement and quality declaration purposes.
Note that data quality or accuracy is not synonymous with survey quality. Good survey quality is the result of optimally balancing all quality dimensions to suit the specific needs of the primary data users. As an example, if producing timely data is of paramount importance, accuracy may have to be compromised to some extent. Likewise, if a high level of accuracy is needed, temporal comparability may have to be sacrificed to take advantage of the latest and much improved methodologies and technologies. On the other hand, data quality refers to the amount of error in the data. As such, it focuses on just one quality dimension—accuracy.
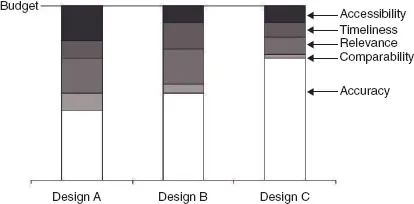
To illustrate this balancing process, Figure 1.2 shows three cost-equivalent survey designs, each with a different mix of five quality dimensions: accessibility, timeliness, relevance, comparability, and accuracy. The shading of the bars in the graph represents the proportion of the survey budget that is to be allocated for each quality dimension. For example, design C allocates about two-thirds of the budget to achieve data accuracy while design A allocates less to accuracy so that more resources can be devoted to the other four dimensions. Design B represents somewhat of a compromise between designs A and C. Determining the best design allocation depends on the purpose of the survey and how the data will ultimately be used. If a very high level of accuracy is required (e.g., a larger sample or a reduction of nonsampling errors), design C is preferred. However, if users are willing to sacrifice data quality for the sake of greater accessibility, relevance, and comparability, then design A may be preferred. Since each design has its own strengths and weaknesses, the best one will have a mix of quality attributes that is most appropriate for the most important purposes or the majority of data users.
Total survey error refers to the totality of error that can arise in the design, collection, processing, and analysis of survey data. The concept dates back to the early 1940s, although it has been revised and refined by a many authors over the years. Deming (1944), in one of the earliest works, describes “13 factors that affect the usefulness of surveys.” These factors include sampling errors as well as nonsampling errors: the other factors that will cause an estimate to differ from the population parameter it is intended to estimate. Prior to Deming’s work, not much attention was being paid to nonsampling errors, and, in fact, textbooks on survey sampling seldom mentioned them. Indeed, classical sampling theory (Neyman 1934) assumes that survey data are error-free except for sampling error. The term total survey error originated with an edited volume of the same name (Andersen et al. 1979).
Optimal survey design is the process of minimizing the total survey error subject to cost constraints [see, e.g., Groves (1989) and Fellegi and Sunter (1974)]. Biemer and Lyberg (2003) extended this idea to include other quality dimensions (timeliness, accessibility, comparability, etc.) in addition to accuracy. They advocate an approach that treats the other quality dimensions as additional constraints to be met as total survey error is minimized (or equiva-lently, accuracy is maximized). For example, if the appropriate balance of the quality dimensions is as depicted by design B in Figure 1.2, then the optimal survey design is one that minimizes total survey error within that fraction of the budget allocated to achieving high data accuracy represented by the unshaded area of the bar. As an example, in the case of design B, the budget available for optimizing accuracy is approximately 50% of the total survey budget. The optimal design is one that maximizes accuracy within this budget allocation while satisfying the requirements established for the other quality dimensions shown in the figure.
Mean-Squared Error (MSE)
The prior discussion can be summarized by stating that the central goal of survey design should be to minimize total survey error subject to constraints on costs while accommodating other user-specified quality dimensions. Survey methodology, as a field of study, aims to accomplish this goal. General textbooks on survey methodology include those by Groves (1989), Biemer and Lyberg (2003), Groves et al. (2009), and Dillman et al. (2008), as well as a number of edited volumes. The current book focuses on one important facet of survey methodology—the evaluation of survey error, particularly measurement error. The book focuses on the current best methods for assessing the accuracy of survey estimates subject to classification error. A key concept in the survey methods literature is the mean squared error (MSE), which is a measure of the accuracy of an estimate. The next few paragraphs describe this concept.
Let
denote an estimate of the population parameter
μ based on sample survey data.
Survey error may be defined as the difference between the estimate and the parameter that it is intended to estimate:
There are many reasons why
and
μ may disagree and, consequently, the survey error will not be zero. One obvious reason is that the estimator of
μ is based upon a sample and, depending on the specific sample selected,
will deviate from
μ, sometimes considerably so, especially for small samples. However, even in very large samples, the difference can be considerable due to
nonsampling errors, meaning errors in an estimate that arise from all sources other than sampling error. The survey responses themselves may be in error because of ambiguous question wording, respondent errors, interviewer influences, and other sources. In addition, there may be missing data due to non-responding sample members (referred to as
unit nonresponse) or when respondents do not answer certain questions (referred to as
item nonresponse). Data processing can also introduce errors. All these errors can cause
and
μ to differ even when there is no sampling error as in a complete census.
In the survey methods literature, the preferred measure of total survey error of an estimate (i.e., the combination of sampling and nonsampling error sources) is the MSE, defined as
which can be rewritten as
where
is the bias of the estimator and
is the variance. In these expressions,
expected value is broadly defined with respect to the sample design as well as the various random processes that g...