![]()
1
Introduction
Some of the most important aspects in food science and food industry today are related to human perception of the food and to enjoyment associated with food consumption. Therefore, very many activities in the food sector are devoted to improving already existing products and developing new products for the purpose of satisfying consumer preferences and needs. In order to achieve these goals one needs a number of experi- mental procedures, data collection techniques and data analysis methods.
1.1 The Distinction between Trained Sensory Panels and Consumer Panels
In this book we will, as usually done, make a clear distinction between studies using a trained sensory panel (Amerine et al., 1965; O’Mahony, 1986; Meilgaard et al., 1999) and studies using consumers (Lawless and Heyman, 1999). The former is either used for describing degree of product similarities and differences in terms of a set of sensory attributes, so- called sensory profiling, or for detecting differences between products, so-called sensory difference testing. For the various attributes, the measurement scale is calibrated and usually restricted to lie between a lower and an upper limit, for instance 1 and 9. A sensory panel will normally consist of between 10 and 15 trained assessors and be thought of as an analytical instrument. For consumer studies, however, the products are tested by a representative group of consumers who are asked to assess their degree of liking, their preference or their purchase intent for a number of products. These tests are often called hedonic or affective tests. While the trained sensory panel is only used for describing the products as objectively as possible, consumer studies are used for investigating what people or groups of people like or prefer. The number of consumers must be much higher than the number of assessors in a sensory panel in order to obtain useful and reliable information. Typically, one will use at least between 100 and 150 consumers in this type of studies.
Note that sometimes the term sensory science is used to comprise all types of tests where the human senses are used. This means that many consumer studies are also sensory tests. The difference between sensory consumer tests and sensory panel tests is the way they are used; sensory panels are used for describing the properties of products and sensory consumer tests are used for investigating the degree of liking. In this book it will be clear from the context and description of the situation which of these studies that is in focus.
Note also that one is often interested in relating the two types of data to each other for the purpose of understating which sensory attributes are important for liking. This is important both for product development studies, for developing good marketing strategies and also for the purpose of understanding more generally what are the opinions and trends in various consumer segments.
In this book, we will concentrate on experimental studies with focus on how sensory assessors or consumers perceive and assess various product properties. Consumer surveys of attitudes and habits will play a minor role here, even though some of the statistical methods treated may also be useful in such situations. In the examples presented main attention will be given to data that are collected by asking people about their opinion (stated acceptance or preference), but many of the same statistical methods can be used if data are obtained by monitoring of real behaviour (revealed acceptance or preference, see e.g. Jaeger and Rose, 2008).
For a broad discussion of possible problems and pitfalls when interpreting results from consumer studies we refer to Köster (2003).
1.2 The Need for Statistics in Experimental Planning and Analysis
In sensory and consumer science one is typically interested in identifying which of a num- ber of potential factors that have an influence on the sensory attributes and/or the consumer liking within a product category. For obtaining such information, the most efficient exper- imental procedures can be found within the area of statistical experimental design (Box et al., 1978). These are methods which describe how to combine the different factors and their levels in such a way that as much information as possible is obtained for the lowest possible cost. For optimising a product, one will typically need to work in sequence, starting out by eliminating uninteresting factors and ending up with optimising the most important ones in a limited experimental region. In all phases it is more efficient to consider series of experiments where all factors are varied instead of investigating one factor at a time. Im- portant building blocks in this tradition are the factorial designs, fractional factorial designs and central composite designs (Chapter 12). The concepts of randomisation and blocking, for systematically controlling uninteresting noise factors, are also important here. Another important point is representativity, which means that the objects and assessors are selected in such a way that they represent the situation one is interested in the best possible way. For instance, if a whole day’s production of a product is to be investigated, one should not investigate consecutive samples, but rather pick them at random throughout the day.
The data sets that emerge from sensory and consumer experiments are typically quite large and the amount of information available about relations between them is limited. It is therefore important to have data analysis methods that in a pragmatic way can handle such situations. Focus in the present book will be on analysis of variance (ANOVA) and regression based methods (Chapter 13, and 15) and methods based on PCA for data compression (Chapter 14, 16, 17). An important aspect of all these methods is that they are versatile and can be used in many practical applications. We will be interested in significance testing for indicating where the most important information is and plotting techniques for visual inspection of complex relations. Validation of models by the use of empirical data will also be important. The main philosophy in the exposition will be simplicity, transparency and practical usefulness.
It is important to emphasise that in order to get the most out of statistical design and analysis methods, one must use as much subject matter knowledge as possible. It is only when statistical and subject matter knowledge play well together that the best possible results can be obtained. It is also worth mentioning that although the book is primarily written with a focus on applications within food science, many of the same methods can be used also for other applications where sensory and consumer aspects are involved.
Other books that cover some of the same topics as discussed here are Gacula et al. (2009), Mazzocchi (2008), Næs and Risvik (1996), and Meullenet et al. (2007).
1.3 Scales and Data Types
In most of the book we will consider sensory panel data and also consumer rating data as continuous interval scale data. This means that the differences between two different values will be considered meaningful, not only the ordering of the data. One of the advantages of taking such a perspective is that a much larger set of methods which are easy to use and understand are made available. It is our general experience that such an approach is both reasonable and useful.
If the data are collected as rank data or as choice/preference data, it is necessary to use methods developed particularly for this purpose. For choice based conjoint experiments one will typically treat the data as nominal categorical data with a fixed set of outcomes and analyse with for instance generalised linear models (see e.g. Chapter 15). The same type of methods can also be used for rank data, but here other options are also available (see Chapter 17).
1.4 Organisation of the Book
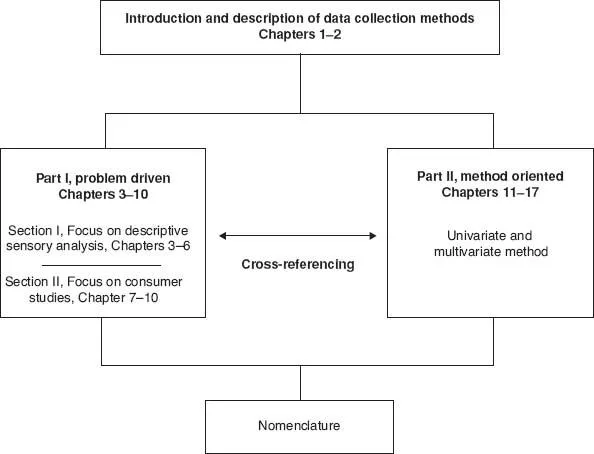
This book is organised in two parts, Part I (Chapters 1-10) and Part II (Chapters 11-17). The first part is driven by applications and examples. The second part contains descriptions of a number of statistical methods that are relevant for the application in Part I. In Part I we will refer to the relevant methodologies presented in Part II for further details and discussion. In Part II we will refer to the different chapters in Part I for typical applications of the methods described. The more practically oriented reader may want to focus on Part I and look up the various specific methods in Part II when needed. The more statistically oriented reader may prefer to do it the other way round. The structure of the book is illustrated in Figure 1.1.
References
Amerine, M.A., Pangborn, R.M., Roessler, E.B. (1965). Principles of Sensory Evaluation of Food. New York: Academic Press.
Box, G.E.P., Hunter, W., Hunter, S. (1978). Statistics for Experimenter. New York: John Wiley & Sons, Inc.
Gacula, M.C. Jr., Singh, J., Bi, J., Altan, S. (2009). Statistical Methods in Food and Consumer Science. Amsterdam, NL: Elsevier.
Jaeger, S.R., Rose, J.M. (2008). Stated choice experimentation, contextual influences and food choice. A case study. Food Quality and Preference 10, 539-64.
Köster, E.P. (2003). The psychology of food choice. Some often encountered fallacies. Food Quality and Preference 14, 359-73.
Lawless, H.T., Heymann, H. (1999). Sensory Evaluation of Food: Principles and Practices. New York: Chapman & Hall.
Mazzocchi, M. (2008). Statistics for Marketing and Consumer Research. Los Angeles: Sage Publications.
Meilgaard, M., Civille, G.V., Carr, B.T. (1999). Sensory Evaluation Techniques (2nd edn). Boca Raton, Florida: CRC Press, Inc.
Meullenet, J-F, Xiong, R., Findlay, C.J. (2007). Multivariate and Probabilistic Analysis of Sensory Science Problems. Ames, USA: Blackwell Publishing.
Næs, T., Risvik, E. (1996). Multivariate Analysis of Data in Sensory Science. Amsterdam: Elsevier.
O’Mahony, M. (1986), Sensory Evaluation of Food, Statistical Methods and Procedures. New York: Marcel Dekker, Inc.
![]()
2
Important Data Collection Techniques for Sensory and Consumer Studies
This chapter gives a brief description of some of the most important methodologies for collecting data in sensory and consumer science. For more detailed and comprehensive presentations of these and related methods we refer to Amerine et al. (1965), Lawless and Heyman (1999) and O’Mahony (1986).
2.1 Sensory Panel Methodologies
2.1.1 Descriptive Sensory Analysis
Descriptive sensory analysis or so-called sensory profiling is probably the most important method in sensory analysis and also the one that will be given the most attention here. This is a methodology which is used for describing products and differences between products by the use of trained sensory assessors. The main advantage of sensory analysis as compared to for instance chemical methods is that it describes the properties of a product in a language that is directly relevant for people’s perception, for instance degree of sweetness, hardness, colour intensity etc. The sensory panel used this way is thought of and used as an analytical instrument.
Typically, a sensory panel consists of between 10 and 15 trained assessors, usually recruited according to their ability to detect small differences in important product attributes. Before assessment of a series of products, the assessors gather to decide on the attributes to use for describing product differences. In some cases, certain attributes may also be given prior to this discussion. Usually, one will utilise some of the products for the purpose of calibrating the scale to be used, if not calibrated by other means. In some cases the assessors are allowed to use their own vocabulary (free choice profiling, FCP, see e.g. Arnold and Williams, 1987), but this type of analysis will not be giv...