![]()
Chapter 1
The Return Dilemma
Charles Lindberg
Family Office Exchange (FOX), a leading provider of research and education to the wealthy and their advisors, released the results of a survey they made in early 2011. For 2011, wealthy families anticipated a median long-term return of 8% from their investments, consistent with previous years’ studies. On the corporate side of the ledger, sentiment is equally optimistic. According to Milliman, a large independent actuarial and consulting firm, large public U.S. companies currently maintain an expected rate of return of 8% for their firms’ pension funds, a slight decrease compared with 8.1% for 2009. The annual Milliman study covers 100 U.S. public companies with the largest defined benefit pension plan assets. Although the expected return has steadily declined during the past decade from a gaudy 9.4% in 2001, an 8% return expectation is still above the long-term averages.
The Milliman study also listed the percentage of pension plan assets invested in equities in 2010, which was 45%, a slight increase from the 44% in the previous year. Bond allocations were unchanged at 36%, and allocation to other investments, including cash, increased from 19% to 20% during 2010. Individual investors, who as a class are typically more aggressive, held 50.9% of their portfolios in stocks and stock funds according to the July 2011 AAII Asset Allocation Survey. This is below average given that the historical standard is for 60% of a typical portfolio to be earmarked for stocks. Bond and bond funds accounted for 25.5% of individual investor portfolios. The historical average is a surprisingly low 15%. This is no doubt due to the low returns earned on cash equivalents. In the survey, individual investors maintained a 23.6% position of their portfolio dollars in cash. The historical average is 25%. The question of all questions is Will the optimists earn the 8% expected return with those allocations? To answer this critical question, an investor must study history and make reasonable assumptions about the future.
An examination of 80 years of data shows the following results:
The annualized return for the Standard & Poor's (S&P) 500 Index (and its precursor S&P 90 Index) between 1930 and 2010 was 9.37%.
Dividends have been a noteworthy contributor to the total return of the S&P 500. From 1930 through 2010, dividends accounted for 43% of the S&P 500s return. The percentage contribution of dividends to the total return has been declining steadily since mid-century. During the past 20 years, dividends have accounted for only a quarter of the total return. U.S. bond market returns are lower in comparison to equities for the 80-year period starting in 1930.
1 The average return is only 5.72%.
Most investors combine investments in stocks and bonds to hopefully produce a better return with less risk. This process is known as asset allocation. The theory is that by including asset categories with investment returns that move up and down under different market conditions within a total portfolio, an investor can potentially enhance return while reducing risk. Historically, the returns of the two major asset categories such as stocks and bonds have not moved up and down at the same time. If one asset is producing losses, such as stocks in 2008, other assets will rise in value to offset your losses. Table 1.1 shows the breakdown of the long-term returns of combining the two assets.
Table 1.1 Asset Allocation History, 1930–2010.
Source: Roger G. Ibbottson and Rex A. Sinquefield, “Stocks, Bonds, Bills, and Inflation: Year-by-Year Historical Returns,” Journal of Business, University of Chicago Press, 2011.
Most individual investors and pension funds would be happy with these long-term return scenarios. However, three key elements have a dramatic impact on whether or not these returns can be realized:
The current price-to-earnings (P/E) ratio of the market
The current dividend yield of the market
The current bond yield of the market
Importance of the P/E ratio
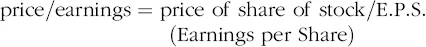
According to the Wall Street Journal, the P/E ratio of the S&P 500 Index at the end of 2011, based on earnings over the past 12 months, was approximately 15. The average P/E ratio of the S&P 500 Index and other large-cap stocks over the past 80 years has been approximately 16, based on 12-month trailing earnings. P/E, of course, stands for price/earnings, and it is one of the essential tools investors use to estimate value when it comes to stock analysis. The price/earnings ratio is one of the oldest and most frequently used metrics. Here is the formula;
The P/E ratio gives you an indi...