![]()
Chapter 1
Evidence of the Most Popular Technical Indicators
Paul Ciana, CMT
Bloomberg LP
The application of various technical indicators is nothing new to the majority of financial market participants. The opportunity to trade a moving average cross or an overbought market is a frequent observation during normal market hours worldwide. The challenge that many ponder is which technical indicators to use. In an effort to resolve that challenge, market participants wonder what others are using. If this information can be identified and verified, market participants will likely monitor those indicators to understand what others are thinking and seeing. Therefore, it might be possible to develop a trading strategy based on the most popular technical indicators.
Although I cannot prove the latter as statistically true, this chapter reveals a hierarchy of the most popular technical indicators on the Bloomberg Professional Service. Then it presents the indicators' commonly accepted signals. But first, it attempts to define what technical analysis represents; it would be ill advised to discuss only indicators when technical analysis is much more than that.
Defining Technical Analysis
Sometimes it seems that the majority of market participants may be misled about the broad scope of theories used in the application of technical analysis when trying to understand and forecast the financial markets. My gut feeling is that if we were to sample a random group of market participants to define technical analysis, they would present terms such as price, moving averages, charts, and oscillators. A simple Internet search confirmed my suspicions about what words we would hear. Some of the definitions that can be easily found do a good job of describing parts of the theory, while others should not be read by a technician who lacks a sense of humor.
Three of the better definitions are:
1. Analysis of past price changes in the hope of forecasting future price changes.
2. Analysis based on market action through chart study, moving averages, volume, open interest, formations, and other technical indicators.
3. An approach to forecasting commodity prices that examines the patterns of price change, rates of change, and changes in volume of trading and open interest, without regard to underlying fundamental market factors.1
Technical analysis offers much more than these definitions suggest. The first is so generic it could be used to describe many fields of analysis. It suggests market participants study prices and fails to elaborate on the variety of data types that can be analyzed. The second mentions market action, a common term used in describing technical analysis, but then repeats itself by listing the data sets that represent market action. It assumes that most of the methods of a technical analyst are focused on technical indicators and therefore it does not elaborate on the variety and depth of the theories in this field of study. The third suggests that technical analysis is used in the commodity markets, which is true, but the application of technical analysis is not restricted to only the commodity markets. Technical analysis can be applied to nearly all types of financial markets.
The methods of a technician span a wide array of theories and use countless different tools to strategize, quantify, and discuss the financial markets in ways that other types of analyses don't or can’t. One of my goals in writing this chapter is to create a one-sentence definition that broadens the scope of the known definitions. It has proved to be very challenging to come up with one sentence that defines technical analysis in its entirety. I believe this is a debate for the entire industry to continuously weigh in on, especially as technical analysis evolves; furthermore, I do not mean to suggest that any one definition would ever be universally acceptable. At present, and with the input of a few friends, I lean toward the following definition:
Technical analysis is the extraction of information from market data into objective visualizations through the use of mathematics with an emphasis on investor behavior and supply and demand to explain the current and anticipate the future path of the financial markets.
This definition suggests that technical analysis comprises the following five attributes:
1. Market data: Represents a variety of data sets that includes the most frequently used ones such as price, volume, and open interest, but does not exclude data sets such as volatility, ticks, ratios, and dividend yields.
2. Objective visualizations: A preference for analyzing information in a chart, but visualizations could be more than a chart, such as a figure, table, scatter plot, or query of results.
3. Use of mathematics: The application of measurements and calculations to measure the market actions of an individual security or a group of securities.
4. Emphasis on investor behavior and supply and demand: We have a bias for identifying rational and irrational market actions and look for imbalances in the availability or desire for a security.
5. Explain the current and anticipate the future: We are attempting to understand what the market is telling us about itself to estimate where it may go in the future.
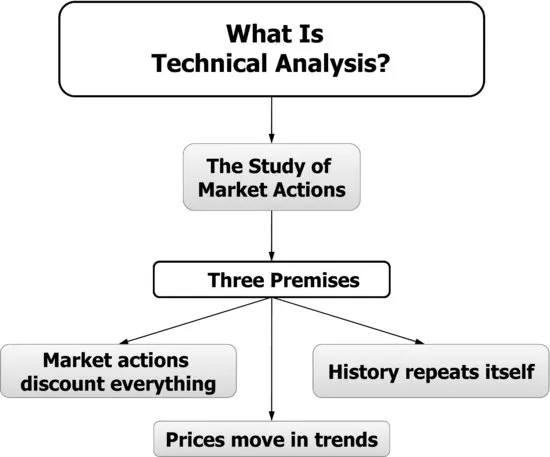
To further explain the definition, we will summarize the three premises of technical analysis (see Figure 1.1) and explain some of the most popular tools (certainly not all) used for this method of analyzing the financial markets.
The first principle states that market actions discount everything. This premise suggests that all publicly available information—such as company-specific news, political changes, weather, and so forth—is already priced into the current value of a security. Therefore we do not necessarily need to know why something is happening; we need only to understand the reaction of investors to what is happening. If the reaction is positive, market participants will push markets higher. If the reaction is negative, market participants will push markets lower. We then employ a host of tools to decipher the impact of that action on the existing trend.
The second principle states that prices move in trends. This relates to Isaac Newton's first law of motion. It suggests that an object in motion remains in motion until acted upon by an equal or stronger force. This force, depending on its strength, can change the direction of motion from its prior path. In technical analysis, this can be thought of as an event or group of events being discounted into the price of a security, causing price to change direction.
The third principle is that history repeats itself—I can still hear my high school history teacher's voice as he quoted, “Those who do not learn history are doomed to repeat it.” This principle suggests that as the dominant generation or the largest group of market participants transitions out of the financial markets, the incoming generation does not learn or receive enough of the previously accumulated information. Therefore we have an inherent bias to repeat many of the same investment and trading decisions, both correct and incorrect, as did previous generations. Some of this tendency to repeat history is represented by price patterns that form on the chart (i.e., a triangle or head and shoulders).
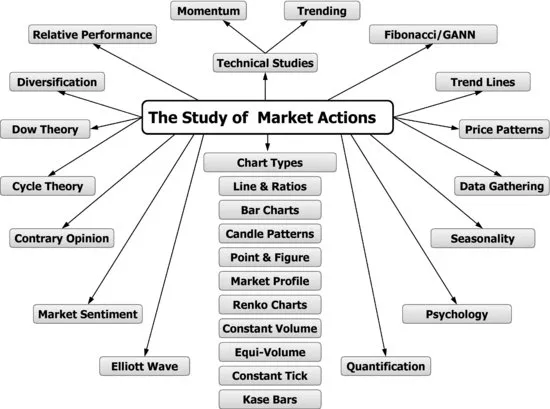
Now that we have a basis for what technical analysis is, we can discuss the tools that a technician uses. Figure 1.2 is a diagram presenting many of the theories and tools that a technician explores to perform an analysis of the financial markets, but it is certainly not inclusive of all the topics. The goal of this figure is to showcase the broad scope of the theories that encompass technical analysis. There are many books that go into detail about these and other topics. Please see the Recommended Reading section at the back of this book for more information.
The remainder of this chapter will address what the most popular chart types and technical studies are on the Bloomberg Professional Service. We will start with a description of the popular chart types and then break down their popularity. Then we discuss the popularity of technical indicators and break down their applications to the financial markets.
Defining Chart Types
Rarely does any market participant make an investment decision without observing the current trend. By simply looking at a line chart, a market participant can see upward, downward, or sideways movements. The work of a technician starts with price, and to look at price we use many different types of charts, such as those listed in Figure 1.2. Although this list is plentiful, it is far from being all-inclusive. Throughout this book, we will familiarize ourselves with the line, bar, candle, log, and intraday charts and identify their ranks in popularity among market participants. Later, we will do the same for the most-preferred technical indicators.
A line chart is a very elegant and simple type of chart to look at. It provides convenience for faster analysis because it shows the overall direction of trend. It is typically used by an economist analyzing economic data sets, a fundamental analyst scanning a list of securities for performa...