![]()
1
Introduction: Challenges to the Fish-Processing Industry in a Resource-Starved World
George M. Hall
1.1 INTRODUCTION
The overriding interest of this book is the sustainability of the fish-processing industry (FPI) by addressing the issues of efficient raw material utilization, energy usage, environmental impact, water usage, packaging and transport among others. However, the industry does not exist alone but, as with any processing industry, sits between the suppliers of the raw material and the consumer. Factors that affect either of these constituencies will have an impact on the processing sector. The size of the impact on the sustainability of the industry will depend on how wide the boundaries of the FPI are drawn. If the boundaries are drawn very narrowly, and just include the activities within the processing unit itself, the impact of outside influences will be very little. However, if the boundaries are drawn to include other activities, the impact will be greater – especially if the transport of raw material and finished products is taken into account.
This chapter will serve as an introduction to the later chapters on specific processes by giving the background to the current state of the World fisheries defined by supply and demand. How this, together with factors such as climate change, fossil fuel depletion and the current economic downturn, can be addressed will command the attention of the industry in the immediate future. All is not doom and gloom and an optimist will see the challenges as opportunities for diversification and process improvement.
1.1.1 Defining sustainability
Although seen as a fashionable sphere of activity today, sustainability, or Sustainable Development (SD), is a discipline that has long been of interest to scientists, technologists, politicians and business alike. Thomas Malthus in his Essay on the Principle of Population of 1798 proposed that the power of population increasing in a geometric ratio would outstrip the power of the earth to sustain mankind increasing in an arithmetic ratio. Thus a link was made between population and sustainability which became the centre of heated and prolonged argument over the policies which would alleviate the problem. In more recent times (1972), the United Nations (UN) held its first major conference on environmental issues entitled the ‘United Nations Conference on the Human Environment (the ‘Stockholm Conference’)’, which recognized political connotations, the ‘North-South Divide’, and environmental problems such as greenhouse gas emissions and depletion of the ozone layer. A major outcome was the setting up of the United Nations Environmental Programme (UNEP) with headquarters in Nairobi, the first UN agency in Africa. In 1980 the International Union for the Conservation of Nature, the World Wildlife Fund and UNEP published the World Environmental Strategy, which included the words ‘Sustainable Development’ in its subtitle (IUCN, 1980).
Consequently, the UN set up a commission in the 1980s to study the issues of global inequality and resource redistribution (World Commission on Environment and Development, 1987) which became known as the Brundtland Commission (after the Chair, Gro Harlem Brundtland, Prime Minister of Norway). The report (also known as ‘Our Common Future’) suggested that economic growth should be wedded to social equality and environmental protection. They also strongly promoted the idea of a sustainable level of world population as an issue to be tackled to achieve these goals. Their oft-quoted definition of SD is:
Sustainable Development is development which meets the needs of the present without compromising the ability of future generations to meet their own needs (World Commission on Environment and Development, 1987).
The SD debate often revolves around the meaning of ‘needs’, as opposed to ‘wants’, in society.
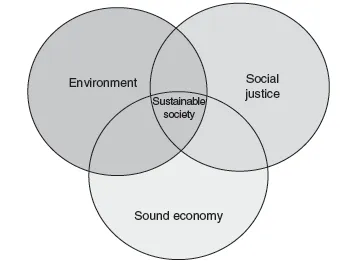
Overall, the Brundtland Commission report suggested that SD issues could be boiled down to the three principles mentioned above, which are environmental concerns, social justice and economics, and overstating the case for any one of these will not achieve SD. A judicious balance between these competing elements is regarded as the ‘Triple Bottom Line’ (TBL) for any enterprise (Figure 1.1). Achieving the TBL has been taken up by business through the adoption of practices under the ethos of ‘Corporate Social Responsibility’ (CSR) as a means to legitimize their activities. There is much debate about the sincerity, practicality and even the legitimacy of these models when applied across the spectrum of nations in view of their wealth, economic life style, cultural attitudes and legislative procedures.
Five years on from the Brundtland Commission, in 1992, the UN held the ‘United Nations Conference on Environment and Development’ (UNCED) in Rio de Janeiro (variously known as the ‘Rio Summit’ or the ‘Earth Summit’) to report on progress and to respond to new threats such as climate change. The meeting addressed the tensions between the need for environmental protection (proposed by the developed nations) and the desire of developing nations for the social and economic benefits enjoyed by the developed world. The rate of consumption of the Earth’s resources and population growth were also high on the agenda. Looked at in these terms the Rio Summit came up with a declaration that ‘the right to development must be fulfilled so as to equitably meet developmental and environmental needs of present and future generations’.
The practical outcome of the conference was a series of major treaties and calls to action which were considered to cover all the SD issues raised by the Brundtland Commission. The five outcomes were:
(i) The Convention on Biological Diversity (an agreed treaty);
(ii) The Framework Convention on Climate Change (an agreed treaty);
(iii) Principles of Forest Management (an agreed treaty);
(iv) The Rio Declaration on Environment and Development;
(v) Agenda 21, which was seen as a blueprint for SD.
Agenda 21 was intended as a means of engaging nations, industry and peoples in SD in order to tackle problems at a local, regional and national level whilst adhering to the TBL principles. A Commission on Sustainable Development (CSD) was set up to monitor the nations (initially 178) which signed up to Agenda 21 and to the principles of the UNCED. Areas of particular concern were: food security and health; energy and transport; consumption and waste; poverty and overpopulation; deforestation and loss of biodiversity. It was noted that any practical steps to solve these issues would require technological change AND demand a behavioural change by individuals and governments, a change in current (and desired) lifestyles and the recognition of our impact on the environment. Agenda 21 was reaffirmed as the plan of action at another UN World Summit on Sustainable development (WSSD) in Johannesburg in 1997. The world approach to fisheries management, production practices, processing and trade encompasses all the SD issues neatly although there is nothing neat about the solutions, given that capture fisheries occur on the open seas and fish (products) are traded internationally.
It is not possible to address the wider SD debate (or indeed the science of climate change) at length here but the reader is urged to engage with it in their interpretation of SD within the FPI. However, it is appropriate to define some specific SD concepts as tools to allow an analysis of the FPI and these will be addressed below.
1.1.2 Sustainable development concepts for FPI
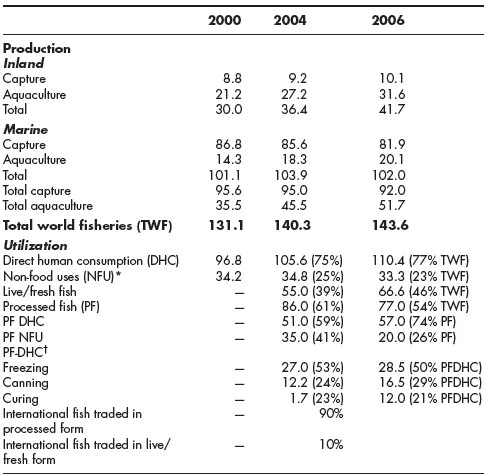
Table 1.1 gives selected data for the World fisheries production (for 2000, 2004 and 2006) to exemplify the trends that will have an impact on the sustainability of the FPI (FAO, 2007a, 2009). Total capture production in 2004 (95.0 million tonnes) was about twice that of aquaculture but in comparison with 2000 the contribution of aquaculture had increased rapidly and this trend had continued by 2006. Certain social trends are associated with this pattern of production so, for example, the number of people engaged in fisheries has increased, but mainly due to the growth in aquaculture activity.
In 2004, approximately 41 million people were estimated to work (full- or part-time) in the fisheries sector (the number had increased to 43.5 million people in 2006) with the vast majority situated in Asia (about 36–37 million people). Of the total number about 25% are involved in aquaculture, although this rises to about 30% for Asia. China alone accounts for 31% of all fishermen (8.5 million) and aquaculturists (4.5 million). Whilst the numbers associated with aquaculture have risen there has been a decline in those employed in capture fisheries by 13% from 2001 to 2004. Overfishing has led to the reduction in fishing fleets through scrapping policies and subsequent redeployment of fishermen, many of whom have gone into aquaculture. The same trends have been seen in the industrialized nations (such as Japan and Norway) but capture fisheries have been very badly hit with numbers of fishers down by 18% from 1990 to 2004, although this is in part due to more efficient running of the fishing vessels which need less personnel as a consequence. At the same time, the average age of the fishermen has increased as younger people do not see fishing as an attractive, lucrative career with long-term prospects. Such people can be replaced by workers from the traditional (and poorer) fishing nations so that there is movement of fishermen around the globe. Finally, as much fishing is seasonal there has been an increasing casualization in the industry with an increase in the numbers of those who class themselves as part-time fishermen.
As ever, there is an incomplete picture of the role of women in fisheries although they are heavily involved in onshore activities such as preservation, processing and marketing. This can be either at the artisanal scale (fish smoking in Africa for example) or the industrial scale (as in the shrimp-processing factories of South-East Asia). Aquaculture is an occupation equally suited to women as men, so an increase in this sector might provide more employment for women.
In 2004 the world capture fleet had stabilized at about 4 million vessels and open boats outnumbered decked boats by 2:1. China operated the biggest fleet in terms of numbers, tonnage and power (over 500,000 vessels, over 7 million gross tonnes and 15.5 million kW, respectively). Virtually all the decked fishing boats were mechanized/powered but only about one third of the open boats were powered, usually by the addition of an outboard motor to a traditional craft. As mentioned above, overfishing has led to a reassessment of fleet capacity with several attempts to restrict and/or reduce numbers being made through compensation schemes, in the EU and China for example, but with little effect on the rate of decline in fishing vessel numbers (FAO, 2009). The imposition of a 200 mile Exclusive Economic Zone (EEZ) by many countries has hit the long-distance fleets of developed countries such as Iceland, Japan, the Russian Federation and Great Britain. The remaining, smaller fleets do, however, consist of bigger, more powerful vessels which offer greater safety and catching power and economic benefit. Inshore fleets (well within the EEZ limit) have grown and the balance between new vessels and scrapping/decommissioning has kept overall numbers steady. The sustainability concerns of an increasingly mechanized and more powerful world fleet are centred on fuel cost and efficiency, especially for distant-water vessels and the increased catching power of the traditional inshore fishery vessels once mechanized. The ability to convert fish oils to fuel (as biodiesel) would seem to be a possible means of maintaining fishing activity and utilizing an FPI by-product in an innovative manner, thus hitting two sustainability targets. On-board processing with mother ships and attendant fishing vessels might be another economic approach for certain fisheries (see Chapter 8).
The degree of exploitation of most fisheries is still a concern, whilst some are improving through good management and the introduction of governance schemes such as Regional Fisheries Management Organizations (RFMO). At the same time, trade in fishery products is at record levels (worth US$71.5 billion in 2004 and rising to US$85.9 billion in 2006) with all exporting countries showing increased trade and with intra- and inter-regional trade high. Such is the importance and value of fish exports (and in many cases the lack of alternative income) that for many countries’ attempts to control fishing activity by national or international fleets are resisted. A recent report on efforts to restore overexploited fisheries showed that the average rate of exploitation (my italics) had declined in five out of ten well-studied ecosystems to a level at which a maximum sustainable yield could be achieved for seven of the systems. However, 63% of assessed fish stocks still require rebuilding and this is only achievable if a combination of fisheries management, catch restrictions, modification of fishing gear and closed areas are applied (Worm et al., 2009). The issue of overfishing would be the subject of a whole book itself and cannot be tackled here, but whatever the outcome of attempts to restore and preserve fisheries it is incumbent on the FPI to make the best use of the catch which comes its way.
Table 1.1 also indicates the trends in fish utilization (for 2004) whereby 61% (86 million tonnes) of the TWF was processed (for DHC and NFU) and of that 59% was for DHC. By 2006 these proportions had changed, with 54% (77 million tonnes) being processed for DHC and NFU (a decrease compared to fresh fish used for DHC) but the proportion of PF for DHC had increased to 74%. Year-to-year figures are difficult to interpret but the decrease in the capture fishery from 2004 to 2006 should lead to less fish being processed for NFU as this sector is dominated by the anchoveta fishery for fishmeal/oil production and so fluctuations in this fishery will lead to less fish being processed for NFU. This would lead to less fish being processed overall, but a greater proportion being processed for DHC, hence the changes. Better reporting of inland fisheries and aquaculture in Africa and Latin America (FAO, 2009) would increase the fresh fish utilization figures as this is the preferred option in these areas. China dominates the freshwater fishery and aquaculture sectors and is suspected of overreporting these sectors, so future figures will show more changes in these statistics (FAO, 2009).
The market for fish is unusual in that the demand for fresh and live fish is always greater than for PF in nearly all societies but the perishability of fish necessitates some form of processing. When fish is processed, the favoured method is freezing (53% in 2004), canning (24% in 2004) and curing (23% in 2004), with the proportions for 2006 being very similar (see Table 1.1). It should be noted that there are marked regional differences in the processing methods employed due to history and the availability of technology. When fish is traded on the international market it is overwhelmingly in the processed form (90%). PF NFU is mainly for fishmeal/fish oil production and hence a proportion will find its way into overall fish production as aquaculture feed.
Table 1.2 Food fish supply by continent and economic grouping in 2003 (FAO, 2007a).
|
| World | 104.1 | 16.5 |
| World (excluding China) | 71.1 | 14.2 |
| Asia (excluding China) | 36.3 | 14.3 |
| China | 33.1 | 25.8 |
| Europe | 14.5 | 19.9 |
| North and Central America | 9.4 | 18.6 |
| Africa | 7.0 | 8.2 |
| South America | 3.1 | 8.7 |
| Oceania | 0.8 | 19.9 |
| Industrialized countries | 27.4 | 29.7 |
| LIFDCs (excluding China) | 23.8 | 8.7 |
| Developing countries (excluding LIFDCs) | 15.8 | 15.5 |
Table 1.2 indicates the world food fish consumption by continent and by economic grouping in 2003. Per capita consumption of food fish has been increasing steadily (from 9.0 kg/yr in 1961 to 16.5 kg/yr in 2003), with China contributing greatly to the increase. There are also marked regional differences as shown by comparing the consumption for China (alone) and Asia (excluding China) to that for Africa and for the LIFDC as a whole. Currently, there are 82 countries described as LIFDC, of which exactly half are in Africa and 25 in Asia. Given that fish is highly nutritious (supplying minerals, proteins and essential fatty acids) attempts to increase consumption in these countries would seem a necessity but may be impeded by the export of fish products to the industrialized countries. The figures do, indeed, suggest a marked difference based on the economic rating of countries. The high consumption in industrialized countries (29.7 kg/yr in 2003 up from 20.0 kg/yr in 1961) has come about, partly, by the availability of high-value products such as shrimps, salmon and bivalves which are produced by aquaculture. The figures for 2005 (FAO, 2009) show little change from those given above: world per capita consumption was 16.4 kg/yr; consumption for industrialized countries 29.3 kg/yr and consumption for LIFDCs 8.3 kg/yr. The differences in consumption by economic grouping also suggest that there is a movement of products from developing/transition counties to the industrialized countries this has both economic and social impacts and sustainability issues relating to the transport itself and the level of processing needed to make such transport possible, as mentioned above. Figure 1.2 illustrates the value of international trade in fish and fish products in 2003, with the balance being overwhelmingl...