![]()
PART 1
INTRODUCTION
![]()
CHAPTER 1
WHAT IS BIODIVERSITY? SPIDERS AS EXEMPLARS OF THE BIODIVERSITY CONCEPT
James P. Gibbs, Ian J. Harrison, and Jennifer Griffiths
What is biodiversity? Ask anybody on the street if they have heard of the word “biodiversity” and you will usually get an affirmative answer. This is because the term has become very widely known – competing with some of the most popular terms from the media on the Internet. Popularly, the term resonates with the general public by conjuring up images of “tropical forest ringing with a cacophony of unseen frogs, insects, and birds; a coral reef seething with schools of myriad iridescent fishes; a vast tawny carpet of grass punctuated by herds of wildebeest and other antelope” (Hunter & Gibbs 2006). But then ask them to define it. Answers will range widely because the term is surprisingly misunderstood.
In practice “biodiversity” typically refers to the number and variety of distinct organisms (species) living on the Earth even though individual species are just one level of organization in living nature. Even with a focus simply on species diversity the concept of biodiversity and the practice of studying it can be overwhelming. The job of sorting out the many millions of species on Earth is the foundation of taxonomy, a subdiscipline within the larger discipline of systematics. The job of the taxonomist is to find an organized way for humans to make distinctions that parallel the distinctions that various organisms make themselves. Such distinctions are fundamental to conservation biology because if we are to maintain biodiversity we must understand how it is organized. In particular, we often need to identify which organisms will be affected by a particular conservation action. Moreover, we often need to focus on not just which species are different from one another but also consider how different they are.
Objective
- To explore the concept of biological diversity as it occurs at various taxonomic levels through the classification of life forms.
Procedures
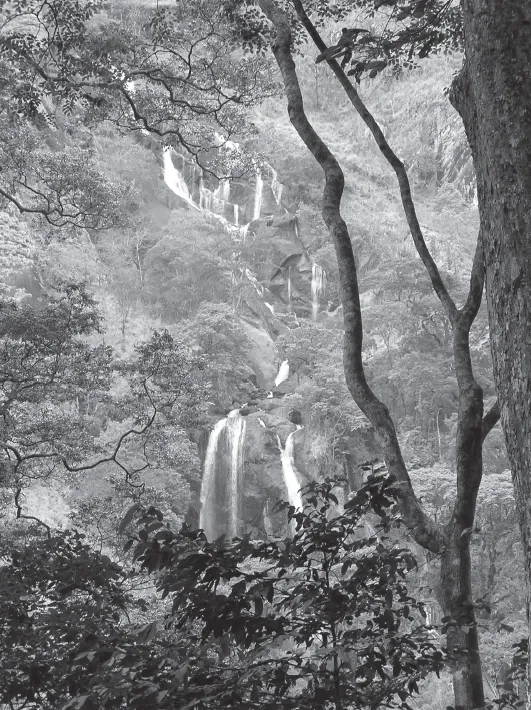
Spiders are a highly species-rich group of invertebrates that exploit a wide variety of niches in virtually all the earth’s biomes. Some species of spiders build elaborate webs that passively trap their prey whereas others are active predators that ambush or pursue their prey. Spiders represent useful indicators of environmental change and community level diversity because they are taxonomically diverse, with species inhabiting a variety of ecological niches, and they are easy to catch.
Sorting and Classifying a Spider Sample Collection
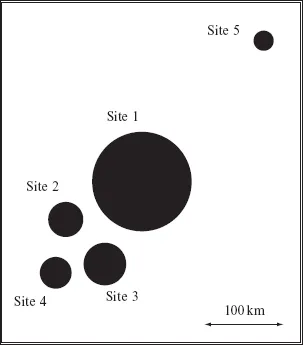
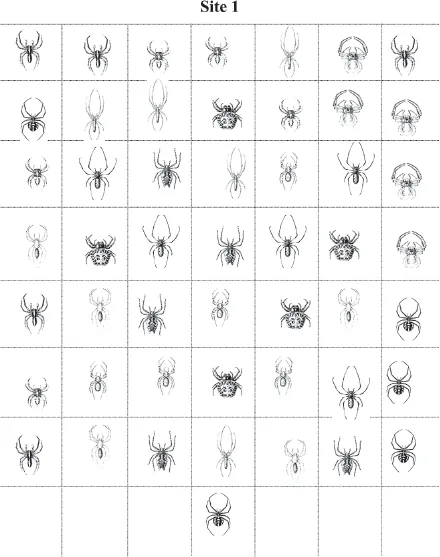
Spider collections have been assembled for you from 5 forest patches (sites 1 through 5) depicted on a map (Figure 1.1). Our first focus is on the spider sample collection for site 1 (Figure 1.2). The spiders were captured by a biologist traveling along transects through the forest patch, striking with a stick a random series of 100 tree branches. All spiders that were dislodged and fell onto an outstretched sheet were collected and preserved in alcohol. They have since been spread out on a tray for you to examine. The illustrations of the spiders collected are aligned in rows and columns so that it is easy to cut them out with scissors (if you wish) for subsequent examination, grouping, and identification.
The next task is to sort and identify the spiders. Look for external characters that all members of a particular group of spiders have in common but that are not shared by other groups of spiders. For example, look for characteristics such as leg length, hairiness, relative size of body segments, or abdomen patterning and abdomen shape. Describe briefly the set of characters unique to each group of morphologically indistinguishable spiders. These “operational taxonomic units” that you define will be considered separate species.
Assign each species a working name, preferably something descriptive. For example, you might call a particular species “spotted abdomen, very hairy” or “short legs, spiky abdomen.” Just remember that names that signify something unique about the species will be more useful to you. Construct a table listing each species, its distinguishing characteristics, the name you have applied to it, and the number of occurrences of the species in the collection.
Has Sampling at Site 1 been Adequate to Characterize the Spider Community?
Next ask whether this collection adequately represents the true diversity of spiders in the forest patch at the time of collection. Were most of the species present sampled or were some likely missed? This is always an important question to ask to ensure that the sample was adequate and hence legitimately characterizes the assemblage of spiders at a site.
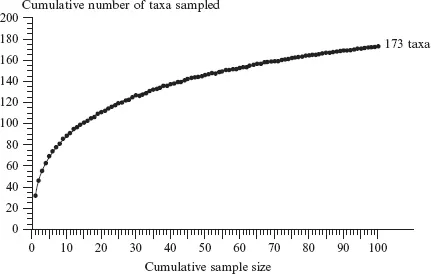
You can address this question by performing a simple but informative analysis that is standard practice for conservation biologists who do biodiversity surveys. This analysis involves constructing a simple, so-called “collector’s curve” (Colwell & Coddington 1994). These plot the cumulative number of species observed (y-axis) against the cumulative number of individuals classified (x-axis). The collector’s curve is an increasing function with a slope that will decrease as more individuals are classified and as fewer species remain to be identified (Figure 1.3). If sampling stops while the collector’s curve is still rapidly increasing, sampling is incomplete and many species likely remain undetected. Alternatively, if the slope of the collector’s curve reaches zero (flattens out), sampling is likely more than adequate as few to no new species remain undetected.
To construct the collectors’ curve for this spider collection, choose any specimen within the collection at random (if you cut up the spider collections with scissors put them in a hat or bag and shake them up). This will be your first data point, such that x = 1 and y = 1, because after examining the first individual you have also identified one new species. Next move in any direction (but consistently so) to a new specimen and record whether it is a member of a new species. In this next step, x = 2, but y may remain as 1 if the next individual is not of a new species or it may change to 2 if the individual represents a new species (different from specimen 1). Repeat this process until you have proceeded through all 50 specimens and construct the collector’s curve from the data obtained (just plot y versus x). Does the curve flatten out? If so, after how many individual spiders have been collected? If not, is the curve still increasing? What can you conclude from the shape of your collector’s curve for site 1 as to whether the sample is an adequate characterization of spider diversity at the site?
Contrasting Spider Diversity among Sites to Provide a Basis for Prioritizing Conservation Efforts
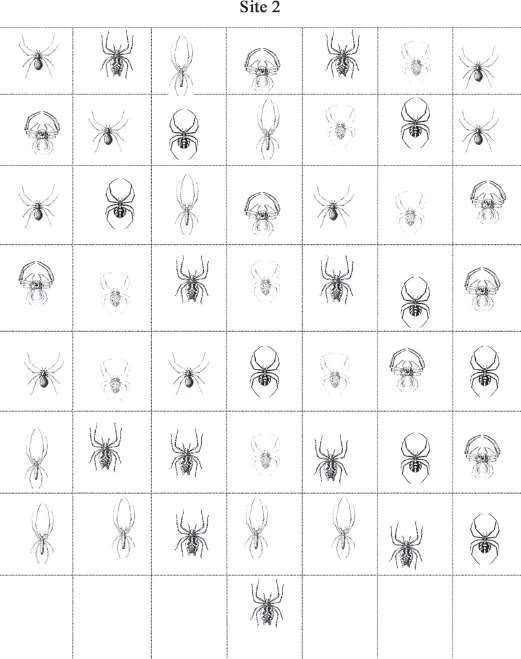
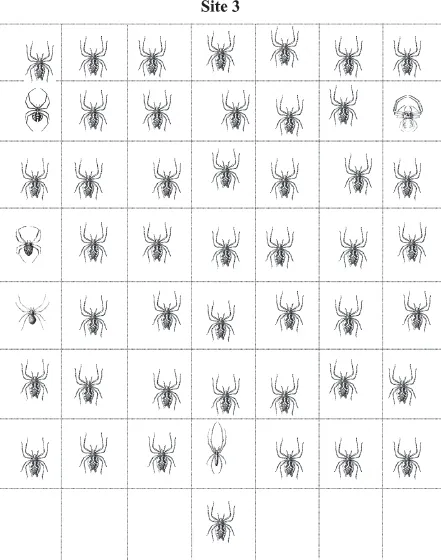
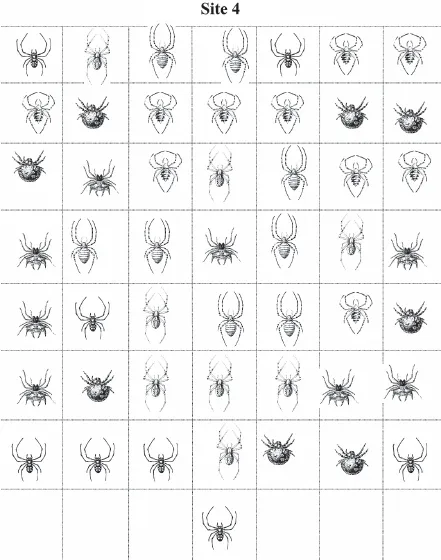
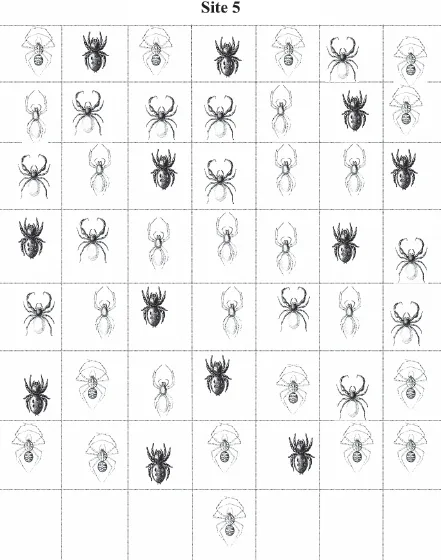
Now you are provided with spider collections from 4 other forest patches. The forest patches have resulted from fragmentation of a once much larger, continuous forest; a stylized map of the fragmented forest patches, showing their size and proximity to each other, is given in Figure 1.1. You will use the spider diversity information to prioritize efforts for the five different forest patches (including the data from the first patch which you have already classified). The additional spider collections are provided in Figures 1.4, 1.5, 1.6, and 1.7.
Again, tally how many individuals belonging to each species occur in each site’s collection (use your classification of spiders completed for Site 1 during Level 1 of the exercise as a starting point with the caveat that you will “discover” some new species at the new sites). Data are most easily handled by constructing a table of species (rows) by site (columns). In the table’s cells put the number of individuals of each species you found in the collection from each site. You can then analyze these data to generate different measures of community characteristics to help you to decide how to prioritize protection of the forest patches. Recall that you need to rank the patches in terms of where protection efforts should be applied, and you need to provide a rationale for your ranking.
Analyzing Community Diversity
You will find it most useful to base your decisions about how to prioritize these sites for protection on three community characteristics:
- species richness within each forest patch
- species diversity within each forest patch
- the similarity of spider communities between patches.
Species richness is simply the tally of different spider species that were collected in a forest patch. Species diversity is a more complex concept. We will use a standard index called Simpson Reciprocal Index, 1/D where D is calculated as follows:
where pi = the fractional abundance of the ith species on an site. For example, if you had a sample of 2 species with 5 individuals each, Simpson Reciprocal Index = 1/((0.5)2 þ (0.5)2) = 1/2 or 0.5. The higher the value, the greater the diversity. The maximum value is the number of species in the sample, which occurs when all species contain an equal number of individuals. Because this index not only reflects the number of species present but also the relative distribution of individuals among species within a community it can reflect how “balanced” communities are in terms of how individuals are distributed across species. Textbooks usually discuss this concept in terms of “evenness.” As a result, two communities may have an identical complement of species, and hence species richness, but substantially different diversity measures if individuals in one community are skewed toward a few of the species whereas individuals are distributed more evenly in the other community.
Analyzing Community Distinctiveness
Diversity is one thing, distinctiveness is quite another. Thus another important perspective in ranking sites is how different the communities are from one another. We will use the simplest available measure of community similarity, that is, the Jaccard coefficient of community similarity (CCJ), to contrast community distinctiveness between all possible pairs of sites:
where c is the number of species common to both communities and S is the total number of species present in the two communities. For example, if one site contains only 2 species and the other site 2 species, one of which is held in common by both sites, the total number of species present is 3 and the number shared is 1, so 1/3 = 33%. This index ranges from 0 (when no species are found in common between communities) to 1 (when all species are found in both communities). Calculate this index to compare each pair of sites separately, that is, compare Site 1 with Site 2, Site 1 with Site 3,…, Site 4 with Site 5 for a total of 10 comparisons. You might find it useful to determine the average similarity of one community to all the others, by averaging the CCJ values across each comparison in which a particular site is included.
Once you have made these calculations of diversity (species richness and Simpson’s Reciprocal Index) and distinctiveness (CCJ), you can tackle the primary question of the exercise:
- How should you rank these sites for protection and why?
- Making an informed decision requires reconciling your analysis with concepts of biological diversity as it pertains to diversity and distinctiveness.
Your decisions can be based principally on your estimates of species richness, diversity, endemicity (species found at only one site), and community similarity. However, once you have made those decisions you might also want to look at the spatial arrangement of the forest patches and compare that to the species distributions. This might help you in your interpretation of the species distributions, and might give useful additional information for ranking the sites for protection.
Considering Evolutionary Distinctiveness
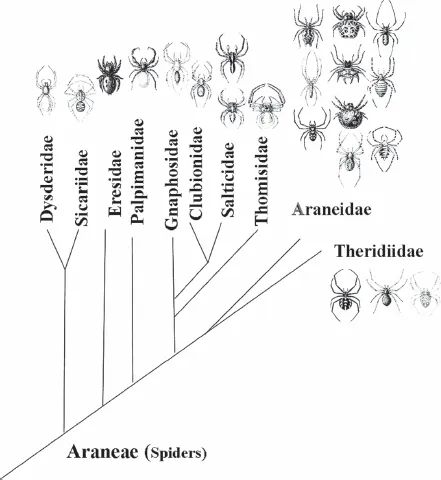
When contrasting patterns of species diversity and community distinctiveness, we typically treat each species as equally important, yet are they? What if a species-poor area actually is quite evolutionarily distinct from others? Similarly, what if your most species-rich site is comprised of a swarm of species that have only recently diverged from one another and are quite similar to species present at another site? These questions allude to issues of biological diversity at higher taxonomic levels. Only by looking at the underlying evolutionary relationships among species can we gain this additional perspective. We have provided below a phylogeny of the spider families that occur in your collections (a genuine phylogeny for these families based in large part on Coddington & Levi, 1991). In brief, the more closely related families (and species therein) are located on more proximal branches within the phylogeny.
First, you need to match your species to the ones shown for the different families in the tree of phylogenetic relationships (Figure 1.8). Do you see any patterns of distributions across the forest patches for related species (that is, species that belong to the same family)?
Next, look for any interesting patterns of distributions of the families across the forest patches. Based on the evolutionary relationships among these families, and their distribution in the forest patches, do you find any additional information that might help inform your decisions on prioritizing forest patches?
Expected Products
- A key to the species of spider identified (descriptive names and diagnostic characteristics, all ordered by family)
- A table of number of individuals tallied by species (rows) by site (columns)
- A ta...