![]()
Chapter 1
Basics of Flow Cytometry
H. Krishnamurthy
National Centre for Biological Sciences, Tata Institute of Fundamental Research, Bangalore, India
L. Scott Cram
Los Alamos National Laboratory, Los Alamos, New Mexico
1.1 Introduction
The ability to discriminate and quantify distinct populations of cells or cell organelles has become increasingly important with the growing trend to focus biological studies on various cell types. Flow cytometry and laser-activated cell sorting are unique techniques that permit the identification, analysis, and purification of individual cells based on the expression of specific markers. Flow cytometers can be used to analyze DNA content and cell cycle distribution, cellular viability, apoptosis, calcium flux, intracellular pH and membrane potential, expression of cell surface and/or intracellular antigens and markers, fluorescent reporter proteins, and chromosomes. One common approach is to conjugate fluorescent dyes to specific antibodies against antigens expressed in a target cell population. Expression of fluorescent marker proteins injected or transfected into target cells is another popular flow cytometric approach. For this purpose, Green, Yellow, Cyan, and Red fluorescent proteins have been used in flow cytometric studies. Fluorescence-activated cell sorters can be used to identify and isolate viable labeled cells, chromosomes, or cell organelles from complex populations for further studies.
1.2 Components of a Flow Cytometer
The key components of a typical analytical flow cytometer include fluidics, lasers, optics, electronic detectors, analog-to-digital converters, and pulse processors.
1.2.1 Fluidic System
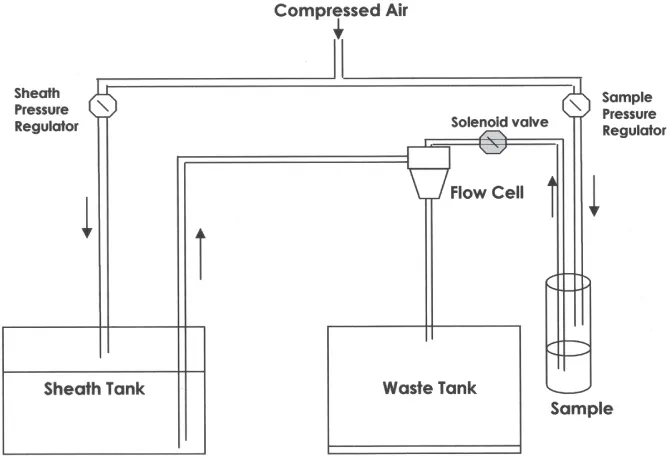
Fluidic systems are designed to rapidly introduce single cells, one at a time, to a point in space where multiple measurements can be made after laser excitation of the individual cells. Cells are aligned much like beads on a string. In general, analytical flow cytometers have a fluidic system such as that shown in Figure 1.1. The sheath fluid is an isotonic buffer, pumped into the flow cell by applying air pressure using a sheath pressure regulator. By applying higher pressure to the sample than that of the sheath flow, a hydrodynamically focused sample stream is created in the flow cell. A narrow sample stream facilitates the creation of a stream where single cells pass one at a time in single file through a laser beam. The sheath and sample leaving the nozzle are collected in a waste tank.
1.2.2 Excitation Light Source
The most commonly used excitation light in a flow cytometer is a laser. However, some cytometers use a mercury arc lamp and/or a light-emitting diode (LED) as a light source. Lasers have the advantage of being coherent and monochromatic. Lasers demonstrate a better signal-to-noise ratio than that of noncoherent light sources such as mercury arc or metal halide lamps. Some of the gas lasers used in flow cytometers with their primary excitation wavelengths are argon ion (488 nm), HeNe (633 nm), and HeCd (355 nm). Solid-state lasers that emit at wavelengths of 355, 375, 407, 488, 561, and 633 nm are available commercially.
1.2.3 Optics
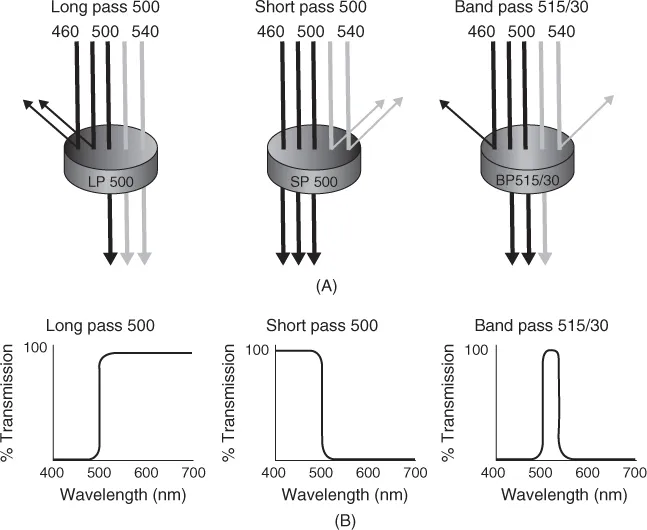
Some of the optical components used in flow cytometers are shown in Figure 1.2A. Combinations of different lens configurations are used to focus the laser beam into either an elliptical or a round beam shape. The excitation optics should withstand milliwatts of laser power. Fluorescence emission optics use primary and secondary dichroic mirrors and long and short pass filters to separate the emitted fluorescence into different wavelengths. Transmission curves for long-pass, short-pass, and bandpass filters are shown in Figure 1.2B. The emission optics include bandpass filters that are placed in front of each photomultiplier detector (Figure 1.3).
1.2.4 Optics Layout
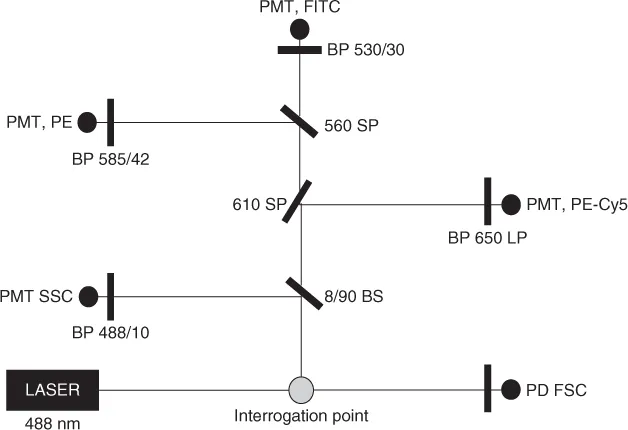
A typical optical layout for a single-laser flow cytometer is shown in Figure 1.3. The cells moving in single file are illuminated by a laser beam at a point in either a flow cell or within a stream in air. The fluorescence emission from laser excitation or laser light scatter is collected by various detectors after passing through several filters and mirrors (Figure 1.3). Scattered signals generated in the direction of the incident light beam (small-angle scatter) are collected by a photodiode. Side or 90° scatter and fluorescence signals are collected by various detectors after passing through appropriate optics. The first filter, a beam splitter, will send 8% of the signals to a side-scatter photomultiplier tube via a bandpass filter (488/10), and 90% of the signals toward a 610SP filter. The 610SP filter will pass fluorescent light shorter than 610 nm and reflect the longer wavelengths toward a bandpass filter (630/22). These red fluorescent signals are collected by the Cy5 detector. Similarly, fluorescent light shorter than 560 nm will pass through the 560SP filter, and green signals will be collected by a fluorescein (FITC) detector after transmission through a 530/30 bandpass filter. Yellow fluorescent signals higher than 560 nm will be reflected and collected after the 585/42 bandpass filter by a phycoerythrin (PE) detector.
1.2.5 Detectors
The most commonly used detectors in flow cytometers are photomultiplier tubes (PMTs) and photodiodes (PDs). Photodiodes have higher quantum efficiency (>90%) than PMTs (<30% in the green range and 15% in the red range). Typically, PDs are used only for the collection of the stronger forward-scatter signals because of their smaller detection area and high intensity of scattered light compared to the fluorescence signals. Second, the PDs have a lower internal gain (102–4) compared to that of PMTs (108). Fluorescent signals, which are normally weaker than those of the scatter, are collected by PMTs, which offer higher gain and amplification.
1.2.6 Amplifiers
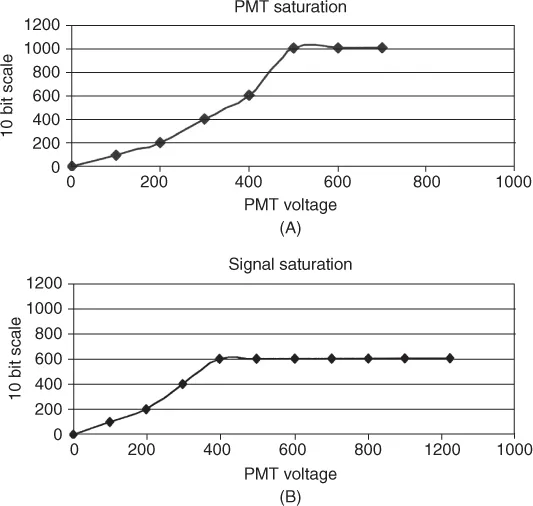
Electronic amplifiers are used in analog flow cytometers. They are connected to the output of the PMTs. Amplifiers are particularly critical if the signals are weak. If the signals are strong, the PMT will saturate at high voltages, as shown in Figure 1.4A, and if the signals are weak, the fluorescence signal will plateau at lower PMT voltages (Figure 1.4B). One has to work at voltage levels that are linear for the range of signals being measured. In such cases the amplifier will be used to enhance the signal intensity.
1.2.7 Analog-to-Digital Converters
Analog signals are collected by a detector and digitalized by an analog-to-digital converter (ADC). Digitalization of the analog signals is required to plot the data as histograms, dot plots, contour plots, density plots, or three-dimensional plots. An ADC is also used to eliminate unwanted or noise signals. Digitized data are also used to perform color compensation and to eliminate spectral overlap from different fluorochromes.
1.2.8 Pulse Processors
The electronic pulse (pulse shape) is different for two cells (G0 + G1) stuck together, as compared to a single cell in G2 or M, whereas the total DNA content for both will be equivalent. Two cells stuck together will have a wider pulse width (PW), a lower pulse height (PH), but the same pulse area (PA) as a mitotic cell. To eliminate doublet events from the final analysis, pulse processing is used to measure the pulse area, width, and height of every pulse. When data of pulse area versus pulse width are plotted as shown in Figure 1.5, single cells will have overlapping area and width signals compared to cell clumps, thus allowing discrimination of single cells from doublets and clumps.