eBook - ePub
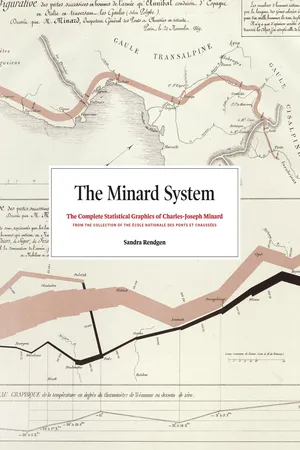
The Minard System
The Complete Statistical Graphics of Charles-Joseph Minard
- English
- ePUB (mobile friendly)
- Available on iOS & Android
eBook - ePub
About this book
If you have any interest in information graphics, maps, or history, you know of the seminal flow map of Napoleon's 1812 march into Russia by Charles-Joseph Minard, made famous by Edward Tufte, and considered to be one of the most magnificent data graphics ever produced. The Minard System explores the nineteenth-century civil engineer's career and the story behind this masterpiece of multivariate data, as well as sixty of Minard's other statistical graphics reflecting social and economic changes of the Industrial Revolution in Europe and around the world. These stunning drawings are from the collection of the École Nationale des Ponts et Chaussées in Paris and have never before been published in their entirety.
Trusted by 375,005 students
Access to over 1.5 million titles for a fair monthly price.
Study more efficiently using our study tools.
Information
Topic
DesignSubtopic
Design General
1
Paris Pavement Maintenance
“Tableau chronologique de l’entretien du pavé de Paris”
No date. Lithographic print, hand-colored. 41.5 × 26.0 cm. Published in: Tableau des progrès de la dépense du pavé de Paris pendant les deux derniers siècles (Paris, 1825)
This diagram accompanies a pamphlet about the maintenance of the Paris pavement from 1632 to 1820. Minard described it as a “visual register” that he drew “in order to better grasp all the circumstances of the maintenance.” 1 The colored graphs visualize several metrics Minard calculated by drawing from historical contracts. The yellow graph indicates the total pavement surface area in Paris, while the blue one shows the total maintenance expenditures per annum. The vertical axis is not labeled; instead, readers have to make do with horizontal scales provided for each graph in the top left section. Punctuated graphs indicate a lack of data sources. The diagram reveals a pattern break after the Revolution of 1789, when the maintenance budget (blue) nosedived for several years. At the same time, the average maintenance price per square meter (rose) grew because the pavement gradually wore out.
MINARD TRANSLATED


2
Major Canals and Railroads in England
“Principaux canaux et railways d’Angleterre en concurrence”
1844. Lithographic print. 52.5 × 66.9 cm. Published in: Des conséquences du voisinage des chemins de fer et des voies navigables (Paris: Fain et Thunot, 1844)
This map shows English waterways and railroads and was published in a brochure that discussed the relationship between existing canals and new railroad routes. The booklet contained many data tables to support Minard’s argument that railroads should be built along valleys, i.e., in the vicinity of existing canals. Like the majority of his maps, this work is reduced to the absolute minimum of graphic means: England’s coastlines are barely distinguishable, and the inner landscape is not depicted at all except for a number of location names and a tangle of traffic routes.

3
Circulation on Several Railroads
“Tableaux figuratifs de la circulation de quelques chemins de fer”
May 1844. Lithographic print. 43.4 × 33.7 cm. Published in: Des tableaux graphiques et des cartes figuratives (Paris, 1861)
This is Minard’s earliest tableau graphique. He was convinced that new railroad lines should not just serve their two end destinations, but also foster regional traffic between towns along the route.2 Here he analyzed the traffic on several Belgian and French lines. The height of each bar represents the number of passengers traveling along that section, while the width shows the relative distance. The light hachures denominate the passengers per section, while the dark hachures refer to passengers who traveled the full distance. Minard notes that the traffic is shown “in one single direction”; however, there is no indication which direction he means.

4
Circulation of Passengers Between Dijon and Mulhouse
“Carte de la circulation des voyageurs par voitures publiques sur les routes de la contrée où sera placé le chemin de fer de Dijon à Mulhouse”
March 1845. Lithographic print, hand-tinted. 71.0 × 45.3 cm. Published in: Des tableaux graphiques et des cartes figuratives (Paris, 1861)
In this revolutionary map, created in the middle of a debate about where to project the railroads between Dijon and Mulhouse in eastern France, Minard analyzed the street traffic on preexisting roads in the region. It is the first time that he implemented the flow map method. The width of each section indicates how many passengers annually traveled on the street. The map itself is extremely stripped down; it features barely any landscape details other than a network of local place names and rivers. The graphic survived in two versions: In the earlier one, the flow is colored in one tint only. Later, Minard differentiated between passengers who traveled on only one section of the road (darker tint) and those who traveled longer distances (lighter tint).
MINARD TRANSLATED
Table of contents
- Cover
- Half title
- Title
- Contents
- Preface: The Story Behind the Masterpiece
- Introduction: The Minard System: A Geography of Flux
- Catalog of Statistical Graphics
- Appendices
- Notes
- Bibliography
- List of Figures
- Index
- Acknowledgments
- Copyright
- About the Author
Frequently asked questions
Yes, you can cancel anytime from the Subscription tab in your account settings on the Perlego website. Your subscription will stay active until the end of your current billing period. Learn how to cancel your subscription
No, books cannot be downloaded as external files, such as PDFs, for use outside of Perlego. However, you can download books within the Perlego app for offline reading on mobile or tablet. Learn how to download books offline
Perlego offers two plans: Essential and Complete
- Essential is ideal for learners and professionals who enjoy exploring a wide range of subjects. Access the Essential Library with 800,000+ trusted titles and best-sellers across business, personal growth, and the humanities. Includes unlimited reading time and Standard Read Aloud voice.
- Complete: Perfect for advanced learners and researchers needing full, unrestricted access. Unlock 1.5M+ books across hundreds of subjects, including academic and specialized titles. The Complete Plan also includes advanced features like Premium Read Aloud and Research Assistant.
We are an online textbook subscription service, where you can get access to an entire online library for less than the price of a single book per month. With over 1.5 million books across 990+ topics, we’ve got you covered! Learn about our mission
Look out for the read-aloud symbol on your next book to see if you can listen to it. The read-aloud tool reads text aloud for you, highlighting the text as it is being read. You can pause it, speed it up and slow it down. Learn more about Read Aloud
Yes! You can use the Perlego app on both iOS and Android devices to read anytime, anywhere — even offline. Perfect for commutes or when you’re on the go.
Please note we cannot support devices running on iOS 13 and Android 7 or earlier. Learn more about using the app
Please note we cannot support devices running on iOS 13 and Android 7 or earlier. Learn more about using the app
Yes, you can access The Minard System by Sandra Rendgen in PDF and/or ePUB format, as well as other popular books in Design & Design General. We have over 1.5 million books available in our catalogue for you to explore.