This scholarly introductory treatment explores the fundamentals of modern geostatistics, viewing them as the product of the advancement of the epistemic status of stochastic data analysis. The book's main focus is the Bayesian maximum entropy approach for studying spatiotemporal distributions of natural variables, an approach that offers readers a deeper understanding of the role of geostatistics in improved mathematical models of scientific mapping. Starting with a overview of the uses of spatiotemporal mapping in the natural sciences, the text explores spatiotemporal geometry, the epistemic paradigm, the mathematical formulation of the Bayesian maximum entropy method, and analytical expressions of the posterior operator. Additional topics include uncertainty assessment, single- and multi-point analytical formulations, and popular methods. An innovative contribution to the field of space and time analysis, this volume offers many potential applications in epidemiology, geography, biology, and other fields.
“Science is built of facts, as a house is built of stones; but an accumulation of facts is no more a science than a heap of stones is a house.” H. Poincaré
Mapping Fundamentals
The urge to map a natural pattern, an evolutionary process, a biological landscape, a set of objects, a series of events, etc., is basic in every scientific domain. Indeed, the mapping concept is deeply rooted in the human desire for spatiotemporal understanding: What are the specific distributions of proteins in cells? What are the locations of atoms in biological molecules? What is the distribution of potentially harmful contaminant concentrations in the sub-surface? What are the genetic distances of human populations throughout a continent? What are the prevailing weather patterns over a region? How large is the ozone hole? How many light-years do galaxies cover? Answers to all these questions—extending from the atomic to the cosmic—are ultimately provided by means of good, science-based spatiotemporal maps.
Furthermore, studies in the cognitive sciences have shown that maps are particularly suitable for the human faculty of perception, both psychological and neurological (Anderson, 1985; Gregory, 1990). These faculties can most efficiently recognize characteristic elements of information when it is contained in a map that helps us build visual pictures of the world. Every scientific discipline depends fundamentally on the faculty of perception in order to interpret a process, derive new insights, conceptualize and integrate the unknown.
What exactly is a spatiotemporal map? The answer to this question depends upon one’s point of view, which is, in turn, based on one’s scientific background and practical needs. From a geographer’s point of view, a map is the visual representation of information regarding the distribution of a topographic variable in the spatiotemporal domain (e.g., ozone distribution, radon concentration, sulfate deposition, disease rate). From an image analyst’s perspective, a map is the reconstruction of some field configuration within a confined region of space/time. From a physical modeler’s standpoint, a map is the output of a mathematical model which represents a natural phenomenon and uses observations, boundary/initial conditions, and other kinds of knowledge as input. While the viewpoints of the geographer and the image analyst are more descriptive, that of the physical modeler is more explanatory. Therefore, a variety of scenarios is possible regarding the way a physical map is produced and the meaning that can be assigned to it:
(i.)The map could be the outcome of statistical data analysis based on a set of observations in space/time.
(ii.)It could represent the solution of a mathematical equation modeling a physical law, such as a partial differential equation (pde) given some boundary/initial conditions.
(iii.)It could be the result of a technique converting physical measurements into images.
(iv.)It could be a combination of the above possibilities.
(v.)Or, the map could be any other kind of visual representation documenting a state of knowledge or a sense of aesthetics.
The following example illustrates some of the possible scenarios described above.
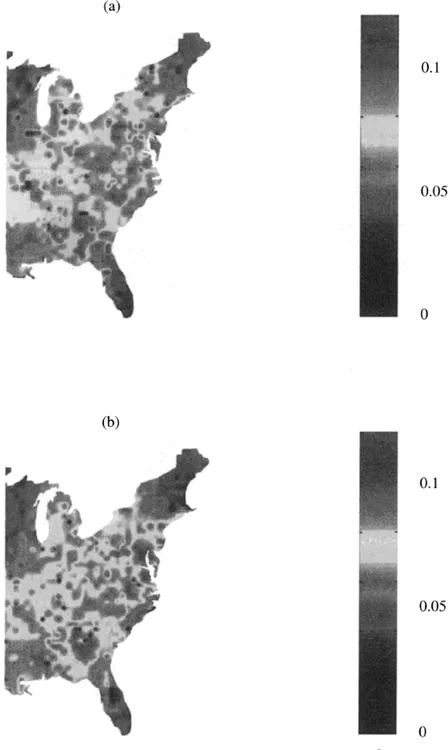
EXAMPLE 1.1: (i.)Studies of ozone distribution over the eastern United States that used data-analysis techniques include Lefohn et al. (1987), Casado et al. (1994), and Christakos and Vyas (1998). These studies produced detailed spatiotemporal maps, such as those shown in Figure 1.1. Interpreted with judgment (i.e., keeping in mind the underlying physical mechanisms, assumptions, and correlation models), these maps identify spatial variations and temporal trends in ozone concentrations and can play an important role in the planning and implementation of policies that aim to regulate the exceedances of health and environmental standards. The use of data-analysis techniques is made necessary by the complex environment characterizing certain space/time processes at various scale levels (highly variable climatic and atmospheric parameters, multiple emission sources, large areas, etc.).
(ii.)While in these multilevel situations most conventional ozone distribution models cannot be formulated and solved accurately and efficiently, in some other, smaller scale applications, air-quality surfaces have been computed using pde modeling techniques. In particular, the inputs to the relevant air-quality models are data about emission levels or sources, and the outputs (ozone maps) represent numerical solutions of these models (e.g., Yamartino et al., 1992; Harley et al., 1992; Eerens et al., 1993).
Figure 1.1. Maps of estimated maximum hourly ozone concentration (ppm) over the eastern U.S. on (a) July 15, 1995, and (b) July 16, 1995. From Christakos and Vyas (1998).
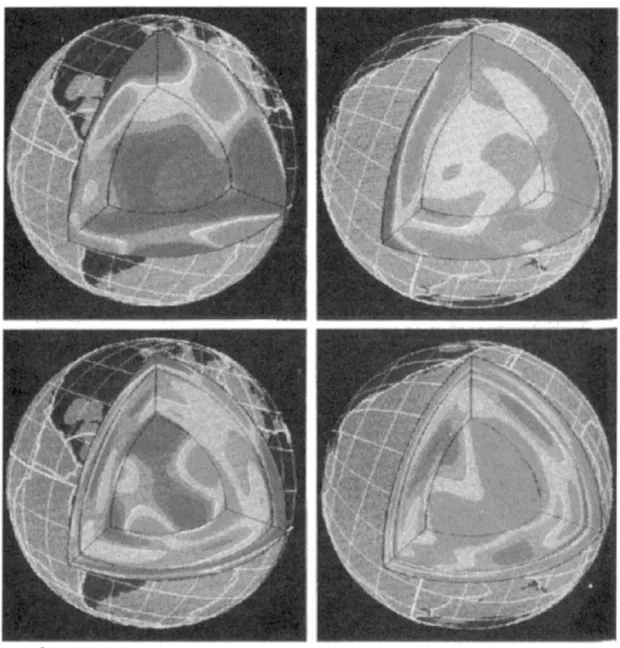
(iii.)Measuring the travel times of earthquake waves and using a seismic tomography technique, the Earth’s core and mantle are mapped in Figure 1.2 (Hall, 1992). As is shown in this figure, the cutaway map that covers the area of the mid-Atlantic ridge is completely different than the cutaway map that covers the area around the East Pacific Rise.
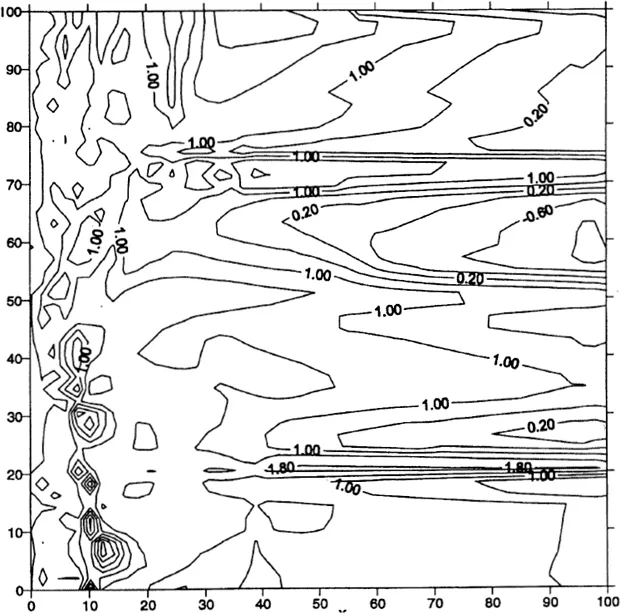
(iv.)Finally, the two-dimensional porous medium map plotted in Figure 1.3 consists of oil-phase isopressure contours for an anisotropic intrinsic permeability field. This map represents the solution of a set of partial differential equations and constitutive relations modeling two-phase (water–oil) flow in the porous medium (Christakos et al., 2000b).
The salient point of our discussion so far is properly expressed by the following postulate. (Postulates presented throughout the book should not be considered as self-evident truths, but rather as possible truths, worth exploring for their profusion of logical consequences. Indeed, a proposed postulate will be adopted only if its consequences are rich in new results and solutions to open questions.)
Figure 1.3. Map of oil-phase isopressure contours for an anisotropic intrinsic permeability field (pressure given in units of entry pressure). From Christakos et al. (2000b).
POSTULATE 1.1: In the natural sciences, a map is not merely a data-loaded artifact, but rather a visual representation of a scientific theory regarding the spatiotemporal distribution of a natural variable.
According to Postulate 1.1, a map is a representation of what we know (a theory) about reality, rather than a representation of reality itself. In view of this representation, scientific explanation and prediction are to some extent parallel processes: a cogent explanation of a specific map should involve demonstrating that it was predictable on the basis of the knowledge and evidential support available. Maps represent one of the most powerful tools by which we make sense of the world around us. In fact, once our minds are tuned to the concept of maps, our eyes find them everywhere.
Why is mapping indispensable to the natural sciences? If a convincing answer to this question is not offered by the discussion so far, the following examples can provide further assistance in answering the question by describing a wide range of important applications in which spatiotemporal mapping techniques play a vital role. The reality is that significant advances in various branches of science have made it possible to measure, model, and thus map a breathtaking range of spatiotemporal domains. Examples 1.2–1.5 below refer to the various uses of maps in agricultural, forestry, and environmental studies.
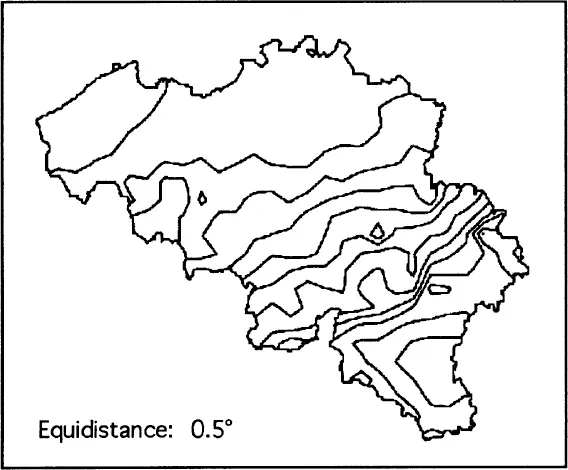
EXAMPLE 1.2: Thermometric maps (see Fig. 1.4) provide valuable information for a variety of atmospheric studies, agricultural activities, pollution control investigations, etc. (Bogaert and Christakos, 1997).
Figure 1.4. Map of the predicted maximum daily temperatures (°Celsius) over Belgium for one day of the year 1990. The equidistance between contours is 0.5°; the lowest level contour is 4.5° (SE part). From Bogaert and Christakos (1997).
EXAMPLE 1.3: In forestry, ground inventory provides important information on biodiversity that cannot be obtained by remote sensing (Riemann Hershey, 1997). A ground inventory, however, is expensive and labor intensive, especially when it covers large areas. Mapping techniques provide the means for estimating unsurveyed areas using a limited number of sample points in space/time.
EXAMPLE 1.4: Assessment of environmental risk due to some pollutant often requires information regarding the pollutant’s distribution on grids covering large spatial domains and multiple time instances (e.g., Bilonick, 1985). This information can be provided most adequately by means of mapping techniques, which on the basis of a limited number of existing measurements and mathematical modeling lead to estimates of the pollutant at other locations and time periods. Also, in studies relating health status to pollutant distribution, an air-quality sampling network usually consists of fewer points in space than are available for health data sets (Briggs and Elliott, 1995). Mapping techniques must then be employed in order to derive pollutant estimates in wider area units.
EXAMPLE 1.5: Using data from satellites orbiting the Earth, spatiotemporal maps of radioactivity in the atmosphere (Fig. 1.5) revealed unusually high energy emissions which made the detection of the nuclear incident at Chernobyl possible, prior to its official Soviet ackn...
Table of contents
Cover
Title Page
Copyright Page
Dedication
Preface
Contents
1. Spatiotemporal Mapping in Natural Sciences
2. Spatiotemporal Geometry
3. Physical Knowledge
4. The Epistemic Paradigm
5. Mathematical Formulation of the BME Method
6. Analytical Expressions of the Posterior Operator
7. The Choice of a Spatiotemporal Estimate
8. Uncertainty Assessment
9. Modifications of Formal BME Analysis
10. Single-Point Analytical Formulations
11. Multipoint Analytical Formulations
12. Popular Methods in the Light of Modern Spatiotemporal Geostatistics
13. A Call Not to Arms but to Research
Bibliography
Index
Frequently asked questions
Yes, you can cancel anytime from the Subscription tab in your account settings on the Perlego website. Your subscription will stay active until the end of your current billing period. Learn how to cancel your subscription
No, books cannot be downloaded as external files, such as PDFs, for use outside of Perlego. However, you can download books within the Perlego app for offline reading on mobile or tablet. Learn how to download books offline
Perlego offers two plans: Essential and Complete
Essential is ideal for learners and professionals who enjoy exploring a wide range of subjects. Access the Essential Library with 800,000+ trusted titles and best-sellers across business, personal growth, and the humanities. Includes unlimited reading time and Standard Read Aloud voice.
Complete: Perfect for advanced learners and researchers needing full, unrestricted access. Unlock 1.4M+ books across hundreds of subjects, including academic and specialized titles. The Complete Plan also includes advanced features like Premium Read Aloud and Research Assistant.
Both plans are available with monthly, semester, or annual billing cycles.
We are an online textbook subscription service, where you can get access to an entire online library for less than the price of a single book per month. With over 1 million books across 990+ topics, we’ve got you covered! Learn about our mission
Look out for the read-aloud symbol on your next book to see if you can listen to it. The read-aloud tool reads text aloud for you, highlighting the text as it is being read. You can pause it, speed it up and slow it down. Learn more about Read Aloud
Yes! You can use the Perlego app on both iOS and Android devices to read anytime, anywhere — even offline. Perfect for commutes or when you’re on the go. Please note we cannot support devices running on iOS 13 and Android 7 or earlier. Learn more about using the app
Yes, you can access Modern Spatiotemporal Geostatistics by George Christakos in PDF and/or ePUB format, as well as other popular books in Scienze fisiche & Geologia e scienze della terra. We have over one million books available in our catalogue for you to explore.