In recent years, with the rise of the craft beverage movement, the cider industry has been through a period of rapid commercial and non-commercial growth. Tasting and quality control is a core aspect of successful cider making and it is essential for industry and researchers to characterize cider using a standard, quantifiable metric. This book is a research-based text for understanding both the theory and practice of effectively evaluating the sensory properties of cider.The Professional Handbook of Cider Tasting includes content on the physiological basis of sensory evaluation, effective profiling of sensory evaluation, types and styles of cider, origins of cider quality attributes and direction for pairing cider with foods. The book also: - Covers a broad range of cider tasting techniques with associated technical explanations.- Provides data and research-driven information.- Contains sample sensory evaluation sheets, a tasting wheel, and guidance for creating fresh cider sensory standards and the utilization of various apple cultivars.Including a summary of the current global cider styles, this is an invaluable resource for commercial cidermakers, non-commercial cidermakers, students on cider production courses, researchers and other industry and stakeholder personnel.
eBook - ePub
Professional Handbook of Cider Tasting, The
- 96 pages
- English
- ePUB (mobile friendly)
- Available on iOS & Android
eBook - ePub
Professional Handbook of Cider Tasting, The
About this book
Trusted by 375,005 students
Access to over 1.5 million titles for a fair monthly price.
Study more efficiently using our study tools.
Information

Introduction 1
Nine years after first landing at Plymouth Rock, European colonists planted apple trees in Massachusetts Bay (Orton, 1995). By the 1670s, orchards in New England were producing up to 500 barrels or a little more than 32,000 gallons of cider annually (Bender, 2009). In 1721, several villages in New England reported cider production of more than 192,000 gallons per year (Williams, 1990). It became common for homesteads to include an apple orchard, and fermentation provided a means to extend the shelf life of apples beyond the growing season (Orton, 1995). Cider was the most popular alcoholic beverage made and consumed in the U.S. until the early 1900s. Mass migration of populations from farms to cities during the Industrial Revolution resulted in the abandonment of orchards and a drop in the supply of fruit. At the same time, mass immigration of beer-drinking Europeans to urban areas provided for the rise of a new beverage culture that was fueled by the availability of inexpensive grain from the Midwest. As a result of Prohibition—a constitutional ban on the production of alcohol for trade from 1920 to 1933—cider’s share in the beverage market sharply declined. The production of cider plummeted from a peak of 55 million gallons in 1899 to 13 million gallons in the late 1930s (Watson, 1999). The tradition of cidermaking, which by then was virtually absent on a large commercial scale, would be kept alive merely by farmers and enthusiasts (Orton, 1995).
The rise of the craft beverage movement in the last decade has resulted in cider experiencing a re-birth. From 2012 to 2016, the industry experienced an annualized growth rate of 27.3%, reaching $300.4 million in revenue, and for the next five years it is projected to continue growing at a more sustainable rate of 1.2% (Petrillo, 2016). As of 2016, there were 608 reported cidermakers across 44 states and the District of Columbia, with New York, Michigan, and California fostering more than 60 cidermakers each (Statista, 2017). Washington State, the top dessert apple-producing state in the U.S., experienced a 22-fold increase in the volume of cider produced in the last 10 years, from under 50,000 gallons in 2007 to nearly 1,000,000 gallons in 2016 (Alcohol and Tobacco Tax and Trade Bureau, 2017).
Cider apple cultivars in the U.S. have traditionally been categorized according to the English classification system, a system focused specifically on fruit acidity and tannin levels (Table 1). Bittersweets (e.g., “Brown Snout” and “Dabinett”) and bittersharps (e.g., “Kingston Black” and “Porter’s Perfection”) have been the most sought after cultivars for producing high quality, full-bodied ciders (Williams, 1975; Bore and Fleckinger, 1997), but they represent only a minority of what is planted and available to cidermakers across the country. Of the 74 cider apple cultivars maintained in the WSU Mount Vernon NWREC collection, less than half have been classified as a bittersweet or bittersharp per their performance in a maritime climate. Sweets (e.g., “Gravenstein” and “Jonagold”) are the least desired cultivars, but currently are the most utilized on a volume basis, as they are most readily available and cost effective (Merwin et al., 2008; Moulton et al., 2010). In Washington State for example, the 2015 average price point for cider apples was $0.375 per lb and for cull dessert apples $0.17 per lb (NWCA et al., 2016).
Table 1. Cider apple classification system developed in England at the Long Ashton Research Station (LARS) in Bristol (Barker, 1903).
| English classification | Tannin (%) 1 | Acid (%) 2 |
| Bittersweet | > 0.20 | < 0.45 |
| Bittersharp | > 0.20 | > 0.45 |
| Sharp | < 0.20 | > 0.45 |
| Sweet | < 0.20 | < 0.45 |
1Tannin expressed as tannic acid equivalents, in percent.
2Titratable acidity expressed as malic acid equivalents, in percent.
Quantification of cider apple juice acidity and tannin levels has traditionally been accomplished utilizing titrimetry. Fruit acidity, specifically titratable acidity (TA), can be measured by incrementally adding a strong base such as sodium hydroxide (NaOH) to a sample of diluted juice until a visually confirmed (utilizing a color indicator such as phenolphthalein) or pH monitored (utilizing a pH meter) neutralization point is reached (Fig. 1). TA is measured in units of malic acid equivalents, as malic acid is the predominant organic acid in cider apples. TA in percent malic acid equivalents is quantified using the following equation:
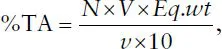
where: N = normality of titrant(commonly sodium hydroxide),
V = volume of titrant,
Eq.wt = equivalent weight of acid of interest,
v = volume of sample.
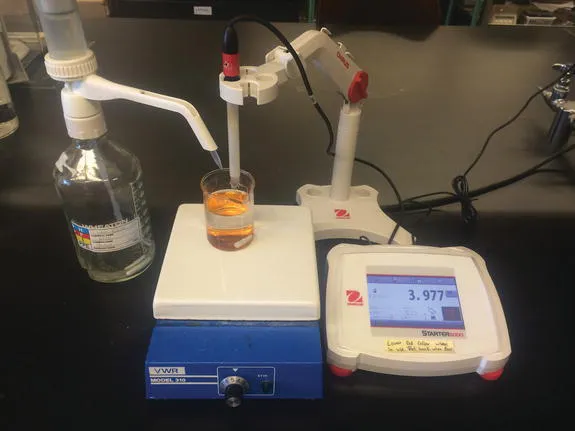
Fig. 1. Titratable acidity measurement setup (left to right): titrant in an electronic burette (0.2 N sodium hydroxide; digitrate 50 mL, Jencons Scientific Ltd, Bridgeville, PA), diluted juice sample (25 mL juice, 100 mL water, and a small magnetic stir bar) on a stir plate (310 Magnetic Stirrer, VWR Scientific, Radnor, PA), and pH meter (Starter 5000 pH Bench, OHAUS, Parsippany, NJ) (photo courtesy T. Alexander, WSU).
Fruit tannin, specifically titratable tannin (TT), can be measured by incrementally adding the strong oxidizing agent potassium permanganate (KMnO4) to a sample of diluted juice until a visually confirmed (utilizing the redox indicator indigo carmine) equivalence point (Fig. 2). TT is measured in units of tannic acid equivalents. TT in percent tannic acid equivalents is quantified using the following equation:
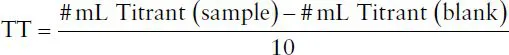
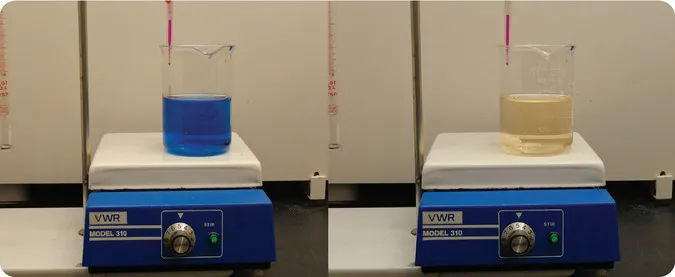
Fig. 2. Titratable tannin assay before and after diluted juice sample (blue; 1 mL juice, 150 mL water, and 5 mL acidified indigo carmine solution) and fully titrated juice sample (yellow; juice, indigo carmine, and titrant), both on a stir plate (310 Magnetic Stirrer, VWR Scientific, Radnor, PA) with a manual glass burette with titrant (pink; 0.005 M potassium permanganate) (photo courtesy T. Alexander, WSU).
It is important to note that this TT method provides for a measure of oxidizable compounds in general, delivering an inexact indicator of bitterness and astringency or even of polyphenols in general. Research is underway at universities such as WSU, Cornell, and Virgin...
Table of contents
- Cover
- Half Title
- Dedication
- Title
- Copyright
- Contents
- Preface
- Acknowledgments
- About the Authors
- 1. Introduction
- 2. Sensory Evaluation: The Physiological Basis
- 3. Sensory Evaluation: Effective Profiling
- 4. Types and Styles of Cider
- 5. Origins of Cider Quality Attributes
- 6. Pairing Cider with Food
- Appendix
- Glossary
- References
- Index
Frequently asked questions
Yes, you can cancel anytime from the Subscription tab in your account settings on the Perlego website. Your subscription will stay active until the end of your current billing period. Learn how to cancel your subscription
No, books cannot be downloaded as external files, such as PDFs, for use outside of Perlego. However, you can download books within the Perlego app for offline reading on mobile or tablet. Learn how to download books offline
Perlego offers two plans: Essential and Complete
- Essential is ideal for learners and professionals who enjoy exploring a wide range of subjects. Access the Essential Library with 800,000+ trusted titles and best-sellers across business, personal growth, and the humanities. Includes unlimited reading time and Standard Read Aloud voice.
- Complete: Perfect for advanced learners and researchers needing full, unrestricted access. Unlock 1.5M+ books across hundreds of subjects, including academic and specialized titles. The Complete Plan also includes advanced features like Premium Read Aloud and Research Assistant.
We are an online textbook subscription service, where you can get access to an entire online library for less than the price of a single book per month. With over 1.5 million books across 990+ topics, we’ve got you covered! Learn about our mission
Look out for the read-aloud symbol on your next book to see if you can listen to it. The read-aloud tool reads text aloud for you, highlighting the text as it is being read. You can pause it, speed it up and slow it down. Learn more about Read Aloud
Yes! You can use the Perlego app on both iOS and Android devices to read anytime, anywhere — even offline. Perfect for commutes or when you’re on the go.
Please note we cannot support devices running on iOS 13 and Android 7 or earlier. Learn more about using the app
Please note we cannot support devices running on iOS 13 and Android 7 or earlier. Learn more about using the app
Yes, you can access Professional Handbook of Cider Tasting, The by Travis Robert Alexander,Brianna L Ewing Valliere in PDF and/or ePUB format, as well as other popular books in Technology & Engineering & Horticulture. We have over 1.5 million books available in our catalogue for you to explore.