For more than twenty years, Global Environmental Politics has provided an up-to-date, accurate, and unbiased introduction to the world's most pressing environmental issues. This new edition continues this tradition while covering critical new developments in the field. Through case studies on key issues such as climate change, toxic chemicals, and biodiversity loss, the authors detail the development of major environmental regimes. With new material on the adoption of global Sustainable Development Goals and the 2030 Agenda for Sustainable Development; the December 2015 Paris Climate Change conference; and recent meetings of major conventions on desertification, biological diversity, and more; the authors present a comprehensive overview of contemporary international environmental politics. Global Environmental Politics is vital reading for any student wishing to understand the current state of the field and to make informed decisions about which policies might best safeguard our environment for the future.
- 482 pages
- English
- ePUB (mobile friendly)
- Available on iOS & Android
eBook - ePub
Global Environmental Politics
About this book
Trusted by 375,005 students
Access to over 1 million titles for a fair monthly price.
Study more efficiently using our study tools.
Information
1
The Emergence of Global Environmental Politics
Until the 1980s, most governments regarded global environmental problems as minor issues, marginal both to their core national interests and to international politics in general. Then the rise of environmental movements in industrialized countries and the appearance of well-publicized global environmental threats that affect the welfare of all humankind—such as ozone layer depletion, climate change, and dangerous declines in the world’s fisheries—awarded global environmental issues a much higher status in world politics. Today, environmental issues are globally important both in their own right and because they affect other aspects of world politics, including economic development, trade, humanitarian action, social policy, and even security.
Global concern about the environment evolved in response to expanded scientific understanding of humanity’s increasing impact on the biosphere, including the atmosphere, oceans, forests, soil cover, and a large number of animal and plant species. Many by-products of economic growth—such as the burning of fossil fuels, air and water pollution, hazardous waste, release of substances that destroy stratospheric ozone, production of toxic chemicals, increased use of natural resources, and decreasing forest cover—put cumulative stresses on the physical environment that now threaten human health and economic well-being. The realization that environmental threats have serious socioeconomic and human costs and that unilateral actions by individual countries cannot solve these problems produced increased international cooperation aimed at halting or reversing environmental degradation.
This chapter provides an introduction to global environmental politics. It highlights key economic and environmental trends, introduces and defines important concepts, and traces some of the major intellectual currents and political developments that have contributed to the evolution of global environmental politics.
Global Macrotrends
Global demographic, economic, and environmental macrotrends describe key factors that drive global environmental politics.1 Humanity’s potential stress on the environment is to some extent a function of three key factors: population, resource consumption, and waste production. One way to measure this impact is through an ecological footprint, which measures humanity’s demands on the biosphere by comparing humanity’s consumption against the earth’s regenerative capacity, or biocapacity.2 The ecological footprint measures the sum of all cropland, grazing land, forest, and fishing grounds required to produce the food, fiber, and timber we need and to absorb the wastes emitted. Since the 1970s, humanity’s annual demand on the natural world has exceeded what the earth can renew in a year. This ecological overshoot was at a 50 percent deficit in 2010.3 This means that it now takes natural systems about 1.5 years to regenerate the renewable resources that we use and absorb the waste we produce in a year, and it could reach three years by 2050 in a business-as-usual scenario.4
Population Growth and Resource Consumption
Population growth affects the environment by increasing the demand for resources (including energy, water, food, and wood), the production of waste, and the emission of pollution. These relationships are not fixed, however, and most of the negative impacts result from how we carry out certain activities. Nevertheless, given the dominant economic and social patterns that have existed since the Industrial Revolution, the rapid growth of human population over the last one hundred years has significantly influenced the environment and will continue to do so throughout this century.
In 1900, global population stood at approximately 1.6 billion. Today it is more than 7.3 billion. It took fifty years for global population to go from 1.6 billion in 1900 to 2.5 billion in 1950. It then took only thirty-seven years for it to double, reaching 5 billion in 1987. It passed the 6-billion mark only twelve years later, reached 7 billion in late 2011, and is on pace to reach 8.5 billion by 2030, 9.7 billion by 2050, and 11.2 billion by 21005 (see Figure 1.1).
Projections of future population growth depend on fertility trends, which can be affected by economic development, education, widespread disease, and certain population-related policies. The world’s human population is currently growing at a rate of 1.18 percent annually.6 Although significantly less than the peak growth rate of 2.04 percent from 1965 to 1970, this still means a net addition of eighty-three million people per year.7 Most of this growth, as much as 92 percent,8 will occur in Africa and Asia. China and India alone already account for 37 percent of the world’s population. Moreover, the population in the forty-eight least-developed countries is projected to grow dramatically, from 954 million in 2015 to 1.9 billion in 2050 and 3.2 billion in 2100.9 Population increases have been accompanied by large increases in the consumption of natural resources, including fresh water, forests, topsoil, fish stocks, and fossil fuels. In addition, per capita consumption of natural resources has been rising much faster than population growth. For example, private consumption expenditures (the amount households spend on goods and services) increased more than fourfold from 1960 to 2000, even though the global population only doubled during this period.10 This increase is positive in that it reflects growth in the standard of living for billions of people. At the same time, the aggregate human consumption of natural resources has largely passed sustainable rates.11
FIGURE 1.1 World Population Growth 1950–2050 (Projected)
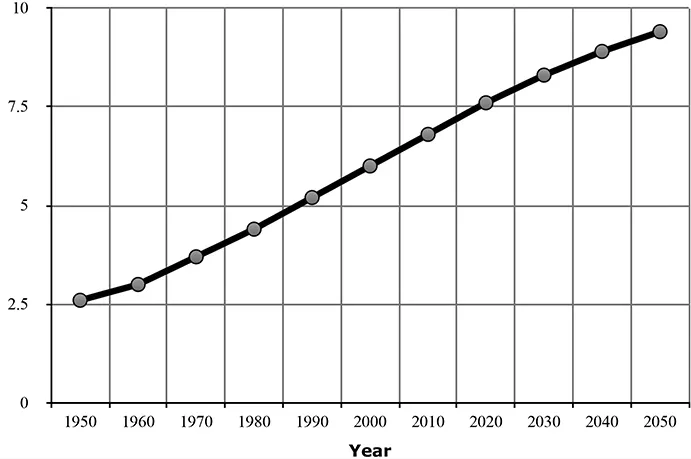
Source: “World Population,” United States Census Bureau, www.census.gov/population/international/data/worldpop/table_population.php.
As more developing countries pursue the lifestyles of North America, Japan, and Europe, the future will likely bring higher per capita rates of consumption unless resources are both consumed more efficiently and recycled more effectively. For example, the population of middle-income countries (including many of the world’s emerging economies, such as Brazil, China, India, Indonesia, Russia, and South Africa) has more than doubled since 1961, while the ecological footprint per person has increased by 65 percent.12 The United Nations (UN) estimates that the global middle class will grow from 2 billion today to 4.9 billion by 2030, with consequently large increases in demands for energy, food, water, and material goods.13
Despite large increases in the consumer class in a number of developing countries, the gulf in consumption levels within and among countries continues to draw attention. High-income countries, such as the United States, have an ecological footprint per capita that is roughly four times that of middle-income countries and five times that of low-income countries.14 The 12 percent of the world’s population that lives in North America and Western Europe accounts for nearly 60 percent of private consumption spending, whereas the 33 percent of the population that lives in South Asia and sub-Saharan Africa accounts for only about 3.2 percent.15 The
United States has had more private cars than licensed drivers since the 1970s, and the average size of new, single-family houses in the United States has grown by more than 60 percent since 197316 despite a decrease in the average number of people per household.17 If everyone consumed resources at the level Americans do, it would take the planet 3.9 years to regenerate the renewable resources used and absorb the wastes produced.18
At the other end of the spectrum, nearly 1.2 billion people—one out of five—live on less than $1.25 a day, and 2.5 billion people live without basic sanitation, the overwhelming majority of whom live in Southern Asia and sub-Saharan Africa.19 A 2014 study estimated that 1.8 billion people drink water contaminated by human or animal waste and even more drink water delivered through systems that lack adequate protections against sanitary hazards.20
Today, the world’s richest countries use on average eleven times more energy than the poorest ones; the richest comprise only 18 percent of the world’s population but use nearly 40 percent of the world’s energy (see Figure 1.2). The United States, with less than 5 percent of the global population, uses about 25 percent of the world’s fossil-fuel resources—coal, oil, and natural gas.21 Sub-Saharan Africa accounts for about 13 percent of global population but only 4 percent of global energy demand.22 The average American consumes 3.5 times more energy than the average global citizen, 3.3 times more than the average Chinese, and 11 times more than the average Indian (and the vast majority of this energy still comes from burning fossil fuels).23 Approximately 590 million people in sub-Saharan Africa and 300 million people in India live almost entirely without access to electricity.24
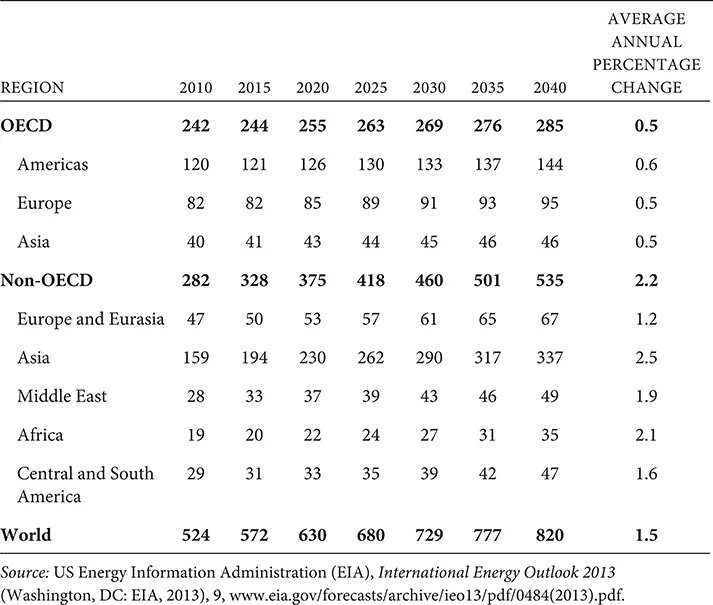
However, energy consumption in developing countries is increasing, driven by industrial expansion, infrastructure improvement, population growth, urbanization, and rising incomes (see Table 1.1). In 1980, China and India together accounted for less than 8 percent of the world’s total energy consumption; by 2014 their combined share had grown to 28 percent.25 In contrast, the US share of total world energy consumption contracted from 22 percent in 2005 to 16 percent in 2014, largely due to improved energy efficiency.26
FIGURE 1.2 Global Energy Use, 2013
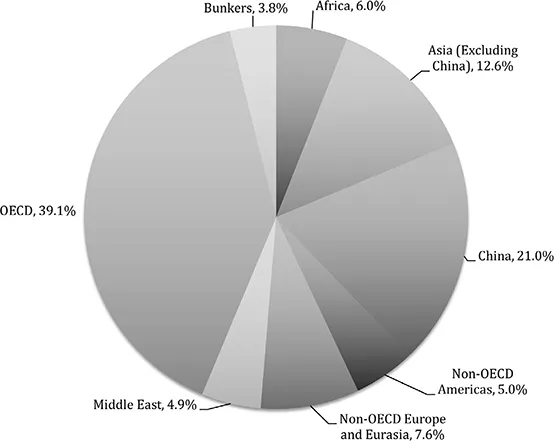
Note: The term bunkers refers to international aviation and international marine fuel depots, which are not included in a specific country’s energy use statistics (or greenhouse gas emissions statistics).
Source: International Energy Agency, Key World Energy Statistics 2015 (Paris: International Energy Agency, 2015), 30, www.iea.org/publications/freepublications/publication/KeyWorld_Statistics_2015.pdf.
Natural Resources and Pollution
Perhaps the largest aggregate impact that humans have on the biosphere is their carbon footprint (see Box 1.1), which has grown more than tenfold since 1960. The United States and China have the largest total national carbon footprints, with China emitting 27 percent of global carbon emissions, followed by the United States with 14 percent.27 In 2013, the United States emitted about twice as much carbon dioxide (CO2) as the entire continent of Africa.28 China has a much smaller per capita footprint than the United States (6.2 tons per person in 2010 versus 17.6 tons in the United States,29 although China’s footprint has increased since then), but its population is more than four times as large. India accounts for about 9 percent of global CO2 emissions, and its national carbon footprint is the third largest, but its per capita footprint is only about 1.6 tons per person.30
TABLE 1.1 Projected World Energy Consumption (Quadrillion BTU) by Country Grouping, 2010–2040
However, an energy sector transition is underway in many parts of the world, leading to an increase in the use of renewable energy. In 2014, renewables became the second largest source of electricity, behind coal. Energy efficiency improvements also helped to restrain the growth of energy demand in 2014 to just one-third of the level it otherwise would have been. According to International Energy Agency projections, energy demand is expected to grow at 1 percent per year to 2040, about half the average annual rate since 1990, due to increased energy efficiency in end uses and structural changes to the economy. CO2 emissions from power generation are expected to grow at only one-fifth of the rate at which power output will increase between now and 2040, breaking the long-standing one-forone relationship.31
Despite positive progress, efforts are not yet enough to move the world onto a pathway consistent with the 2°C climate goal (see Chapter 3). The years 2011–2015 have been the warmest five-year period on record, according to the World Meteorological Organization, and 2015 was the warmest year for which observational records exist.32 If present rates continue, global temperatures will rise by at least 2°C by the end of the century.33
Box 1.1 WHAT IS A CARBON FOOTPRINT?
A carbon footprint is a measure of the impact our activities have on climate change. Many of our daily activities cause emissions of greenhouse gases (GHGs). For example, we produce GHG emissions from burning gasoline when we drive, burning oil or gas for home heating, or using electricity generated from coal, natural gas, and oil. These are considered to be the primary footprint —the sum of direct emissions of carbon dioxide (CO2) from the burning of fossil fuels for energy consumption and transportation. More fuel-efficient cars have a smaller primary footprint, as do energy-efficient light bulbs.
The secondary footprint is the sum of indirect emissions of GHGs during the lifecycle of products used by an individual or organization. For example, the GHGs emitted during the production of plastic for water bottles, as well as the energy used to transport the water, contribute to the secondary footprint. Products with more packaging will generally have a larger secondary footprint than products with a minimal amount of packaging.
Source: Maggie L. Walser, “Carbon Footprint,” in Encyclopedia of Earth, ed. Cutler J. Cleveland, first published July 14, 2010, last revised April 5, 2013, www.eoearth.org/view/article/51cbed2c7896bb431f690448/.
The world’s freshwater resources are also under serious stress. Increased water consumption, rising population, and climate change mean that about 80 percent of the world’s population lives in countries with areas classified as having high levels of threat to water security.34 About 3.4 billion people live in regions with absolute water scarcity.35 Agricultura...
Table of contents
- Cover
- Half Title
- Title Page
- Copyright Page
- Contents
- Preface and Acknowledgments
- List of Acronyms
- Chronology
- 1 The Emergence of Global Environmental Politics
- 2 Actors in the Environmental Arena
- 3 The Development of Environmental Regimes
- 4 The Development of Environmental Regimes
- 5 Effective Environmental Regimes
- 6 Environmental Politics and Sustainable Development
- 7 The Future of Global Environmental Politics
- Appendices
- Notes
- Index
Frequently asked questions
Yes, you can cancel anytime from the Subscription tab in your account settings on the Perlego website. Your subscription will stay active until the end of your current billing period. Learn how to cancel your subscription
No, books cannot be downloaded as external files, such as PDFs, for use outside of Perlego. However, you can download books within the Perlego app for offline reading on mobile or tablet. Learn how to download books offline
Perlego offers two plans: Essential and Complete
- Essential is ideal for learners and professionals who enjoy exploring a wide range of subjects. Access the Essential Library with 800,000+ trusted titles and best-sellers across business, personal growth, and the humanities. Includes unlimited reading time and Standard Read Aloud voice.
- Complete: Perfect for advanced learners and researchers needing full, unrestricted access. Unlock 1.4M+ books across hundreds of subjects, including academic and specialized titles. The Complete Plan also includes advanced features like Premium Read Aloud and Research Assistant.
We are an online textbook subscription service, where you can get access to an entire online library for less than the price of a single book per month. With over 1 million books across 990+ topics, we’ve got you covered! Learn about our mission
Look out for the read-aloud symbol on your next book to see if you can listen to it. The read-aloud tool reads text aloud for you, highlighting the text as it is being read. You can pause it, speed it up and slow it down. Learn more about Read Aloud
Yes! You can use the Perlego app on both iOS and Android devices to read anytime, anywhere — even offline. Perfect for commutes or when you’re on the go.
Please note we cannot support devices running on iOS 13 and Android 7 or earlier. Learn more about using the app
Please note we cannot support devices running on iOS 13 and Android 7 or earlier. Learn more about using the app
Yes, you can access Global Environmental Politics by Pamela S. Chasek in PDF and/or ePUB format, as well as other popular books in Politics & International Relations & Politics. We have over one million books available in our catalogue for you to explore.