Africa is one of the most dynamic continents. It will play a key role in the coming decades in relation to the growth of cities, and environmental conditions will be of primary importance. The structural lack of water and sanitation infrastructure affects the development of Africa's growing urban environments. This book questions the relation between the wide-ranging fields of water and the urban discipline in the Sub-Saharan African context. In particular, it focuses on Dar es Salaam (Tanzania), a city where rapid urbanisation and high annual growth have led to increasing water demand and strained the water and sanitation systems. It examines the spaces water produces, the actors promoting various choices and solutions, the impact of different applied technologies, and the diverse sanitary conditions, focusing on their significance in the shape of the built environment and the urban planning practices and theory. As water occupies and creates spaces, this work tries to establish a relation among the spaces and the structure of the city itself, using infrastructure in the shape of networks that cross the city and on-site systems such as boreholes and latrines, to be considered a hybrid and potentially resilient system.
eBook - ePub
Re-interpreting the Relationship Between Water and Urban Planning
The Case of Dar es Salaam
- 182 pages
- English
- ePUB (mobile friendly)
- Available on iOS & Android
eBook - ePub
Re-interpreting the Relationship Between Water and Urban Planning
The Case of Dar es Salaam
About this book
Trusted by 375,005 students
Access to over 1.5 million titles for a fair monthly price.
Study more efficiently using our study tools.
Information
Topic
ArchitectureSubtopic
Urban Planning & Landscaping1 Introduction
The rationale of the book
The African city today is an intricate pattern of pipes, sewers, pit latrines, oxidation ponds, ventilated septic tanks and standpipes dotting courtyards and open spaces. Water carriers, water trucks and bicycles modified to carry water or wastewater criss-cross the city, refilling tanks and emptying latrines. On-site and off-site systems1 are equally evident, with pipes not necessarily buried in the ground, and standpipes emerging in courtyards typically surrounded by children and women, some washing clothes and dishes. The city’s skyline is filled with blue and black storage tanks, private latrines discharge wastewater directly into small streams, houses surround open oxidation ponds and riverbeds accommodate shelters and slums. The entire water system is exposed, enabling the different models of provision and discharge to be traced across settlements and neighbourhoods.
Because of the instability and unreliability of water networks, both formal and informal, the system assumes hybrid characteristics. The presence of both on-site and off-site systems in many settlements embodies the temporary condition of the city as a whole – a city that is growing, relying where possible on multiple services and thus creating parallel networks that guarantee the liveability. Water is not considered unlimited or cheap. On the contrary, it remains a heavy, precious but necessary resource that forms an integral part of the daily routine.
This book explores the relation between the wide-ranging fields of water and the urban environment in the African context. It examines the spaces water creates, the actors promoting various choices and solutions, the impact of different applied technologies and the diverse sanitary conditions, focusing on their significance in the shape of the built environment and the planning discipline. As water occupies and creates spaces, this work tries to establish a relation between those spaces and the structure of the city itself, using infrastructure either in the form of networks that cross the city or on-site systems such as boreholes and latrines.
The book focuses on Dar es Salaam, a city where rapid urbanization and high annual growth have led to increasing water demand and strained water and sanitation systems. It describes the city from the water perspective, considering the actual water and sanitary conditions of Dar es Salaam and its planning tradition – useful to understanding the city’s development in relation to the water and sanitation strategies that have been implemented since its foundation. The book then examines five areas in the city that highlight different aspects of the changing relation between the urban environment and the water system, proximity to water and management of the resource, and finally it explores the challenges of planning the future city and its water and sanitation systems by analyzing the recent master plan for Dar es Salaam established in 2012.
The rise of urban areas
Half of humanity lives in cities. According to the 2014 United Nations World Population Prospect, 3.97 billion people live in cities: almost 1 billion in more developed regions and 2.97 billion in developing countries. The global urban population is expected to increase to 6.3 billion by 2050, with 83 per cent of that growth occurring in developing countries, for a projected population of 5.25 billion in 2050 (Figure 1.1). Most likely, cities will account for most total population growth, both as a consequence of improvements in the quality of life and by attracting rural populations.
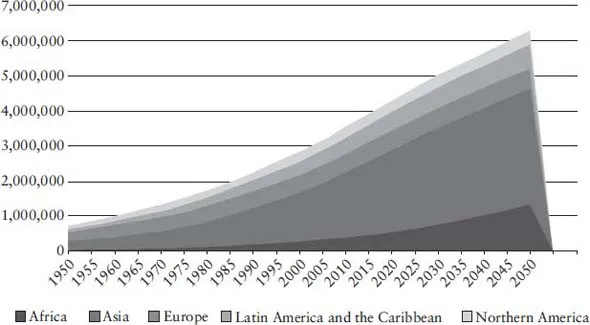
Figure 1.1 Annual urban population at mid-year (thousands)
Source: UNDESA – United Nations, Department of Economic and Social Affairs, Population Division (2014). World Urbanization Prospects: The 2014 Revision.
Africa and Asia, in particular, will witness major changes in terms of national population growth and density, heavily impacting urban systems. At the global level, urban population growth is slowing down. The growth rate decreased from 3.11 per cent in 1950 to 2.05 per cent in 2015 and is forecast to decline to 1.00 per cent in the 2050s. In Africa, however, urban annual growth was 3.55 in 2010, and forecasts predict a growth rate of 2.56 in the 2050s (Figure 1.2).
The urban population is unevenly distributed across cities of different agglomeration sizes. Clusters include urban centres with fewer than half a million inhabitants, accounting for 51 per cent of the urban population, and cities with 1 to 5 million inhabitants, accounting for 20 per cent of the urban population residing in 428 cities in 2015 (2015 data projections, UNDESA, 2014). Although megacities attract the most attention because of their extreme complexity with regard to population growth, resource utilization and geographical position, they only host around 10 per cent of the total urban population. By contrast, cities of medium size (1 to 5 million people) are likely to attract the most rural-urban migrants and experience the most growth in absolute terms.
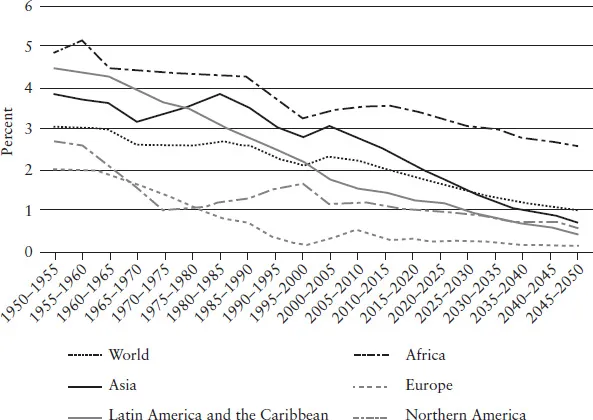
Figure 1.2 Average annual rate of change of the urban population (per cent)
Source: UNDESA – United Nations, Department of Economic and Social Affairs, Population Division (2014). World Urbanization Prospects: The 2014 Revision.
Over the next century, as they expand to support a growing majority of the human population, urban areas will also be the sites of the greatest environmental impact and demand rapid adaptation of water resources. City living necessitates provision of services and infrastructure to millions of people, which is particularly challenging when growth occurs in areas of absolute poverty, often on unallocated land, and its pace is uncontrollable. On the other hand, urban settlements and metropolises are the nodes of the development process and thus the sites of greatest resource concentration. Urban areas provide significant economies of scale and proximity for the delivery of piped water and provision for good-quality sanitation and drainage, so cost units should be lower and penetration greater. At the same time, cities have a more prosperous economic base than rural areas, providing higher incomes for large sections of the population and greater opportunity for governments (or private utilities) to raise revenue to fund services and recover costs from user fees. Urban areas represent the vanguard of water service implementation and will serve as models for emerging urban centres in the coming decades.
The global importance of water and sanitation
Demand for water has increased dramatically with the rapid growth of the world population. The lion’s share of water withdrawal, around 70 per cent, is by the agriculture sector, while industry accounts for 20 per cent and domestic consumption for 10 per cent (Figure 1.3) (FAO, 2016). Efforts to increase access to water and sanitation are being slowed by urban population growth (UNDESA, 2009).
World population increased 4.4 times over the last century, while water withdrawal increased 7.3 times over the same period (FAO, 2016). Global population growth has created greater demand for water in the food sector (for more food production in absolute terms, and due to change in diet) and the energy sector (extraction from water resources that are needed to sustain growth).
Cities are acting as the catalyst of these demands, as they concentrate the need for food, energy and water while producing wastewater, which is a major source of water pollution, particularly in developing countries.
The sudden need for water, the idea that water is finite, the conception of water as a right as well as an economic resource to be managed – all are quite recent developments on the world stage that have taken root in parallel with the booming of the world population and consequent increase in water consumption.
Since water and sanitation issues first arose in the second half of the twentieth century, major international organizations have worked to develop policies that bridge the gap between countries that have achieved water and sanitation coverage and those still struggling to provide their citizens with basic services.
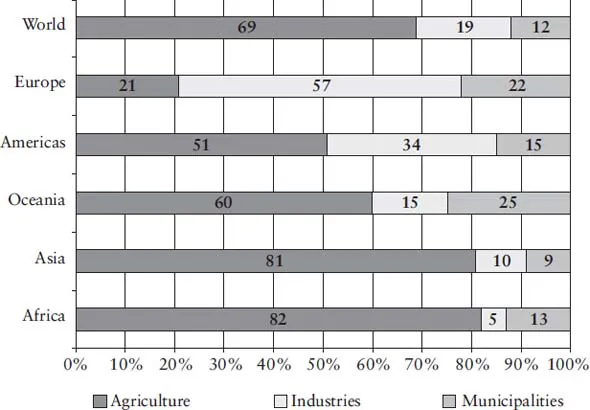
Figure 1.3 Water withdrawal ratios by continent
Source: FAO – Food and Agriculture Organization of the United Nations (2016). AQUASTAT Main Database (FAO).
The United Nations Conference on Human Settlements first addressed access to safe water and sanitation as a priority for development and health in 1976. At the 1977 World Water Conference held in Mar del Plata, a declaration introduced a new era for water and sanitation through cooperation amongst developing countries. At that conference, the United Nations established the International Water Supply and Sanitation Decade, whose goal was to achieve universal water and sanitation by 1990. The Decade was crucial in placing water and sanitation on the international agenda and accelerating the process of water and sanitation provision (Tortajada et al., 2006). Progress was made particularly in providing community water supplies to rural areas. In 1980, only 31 per cent of rural inhabitants had access to a safe water supply, and 13 per cent had access to safe sanitation (Black, 1998). By 1990, these rates had more than doubled, with 64 per cent of the world’s rural population having access to safe water and 41 per cent to safe sanitation (Black, 1998). Other major achievements included progress in monitoring the “hardware”, the infrastructure and water delivery systems as well as different sanitation systems that were spreading throughout developing countries; developing criteria for the “software”, with the goal to “increase the capacity of countries to deliver water supply and sanitation services to low-income groups, primarily with low-cost and community-based approaches” (Black, 1998, p. 27); and finally, to develop a monitoring programme to collect global data on improvements in water and sanitation. At the end of the Decade, 95 per cent of the world’s urban population had access to improved or shared water resources, compared to 64 per cent of the world’s rural population. Access to sanitation was even more imbalanced, as in 1990 87 per cent of the world’s urban population but only 41 per cent of its rural population had access to improved or shared sanitation facilities (WHO and UNICEF, 2010). The goal of “water and sanitation for all” was too broad to achieve, but the legacy of the Water Decade persists in the Millennium Development Goals 2015 (MDG), target 7C: “Halve, by 2015, the proportion of the population without sustainable access to safe drinking water and basic sanitation”.2
The WHO/UNICEF Joint Monitoring Programme for Water Supply and Sanitation is the official United Nations body in charge of monitoring progress towards the Millennium Development Goals. By 2010, the global MDG target for drinking water had already been met, as 91 per cent of the global population (96 per cent of the urban population and 84 per cent of the rural population) used an improved drinking water resource (WHO and UNICEF, 2015). However, the target for sanitation was not met, with improved sanitation reaching 82 per cent of the global urban population, but only 51 per cent of the rural population (WHO and UNICEF, 2015).
Although progress has clearly been made in the provision of safe water and sanitation, some issues continue to impede progress. The first regards the classifications used to define the words “unimproved” and “improved”. The WHO/UNICEF Joint Monitoring Programme defined improved/unimproved resources in the 2000 Global Assessment (Table 1.1). “Improved resources” include all water from a piped supply, drilled well, hand-dug well or spring “protected” from sewage contamination, or collected rainwater, while “unimproved resources” are all sources where contamination cannot be prevented, ranging from rivers to informal water vendors.
Although their aim was to accurately survey the number of people who were not reached by a safe source of water, these parameters highlight the weaknesses of replacing a health target with an engineering target, conflating the concept “improved” with the concept “safe”. This assumption makes the MDG statistics unreliable because they fail to account for the quality of the water pumped and the functionality of infrastructure. As it is very expensive and difficult to control the quality of pumped water, particularly in developing countries, supervision and purification processes are lacking. Thus, improved sources can provide contaminated water.
Furthermore, there is a gap between the presence of an improved means to provide water and the actual functioning of that means. As Pearce recalls in his article (Pearce, 2012), different studies and surveys argue that even if the infrastructure is placed and included within MDG statistics, it might not actually provide the service. For example, in Nigeria, Sierra Leone, the Ivory Coast and the Democratic Republic of the Congo, fewer than half of available hand pumps were functional (Network, 2010)....
Table of contents
- Cover
- Title
- Copyright
- Dedication
- Contents
- 1 Introduction
- 2 Water, sanitation and the African urban world
- 3 Can we describe a city from the water perspective? Dar es Salaam, Tanzania
- 4 Fragmented water spaces: an urban catalogue
- 5 Master planning in Dar es Salaam and its relation to the water system: an historical perspective
- 6 The city between the two master plans (1979–2015)
- 7 The future of Dar es Salaam: initial review of the new master plan, 2012–2032
- 8 Challenges to the planning discipline: the nature of rapidly urbanizing African cities in relation to water and sanitation
- 9 Post scriptum: October 2017
- Index
Frequently asked questions
Yes, you can cancel anytime from the Subscription tab in your account settings on the Perlego website. Your subscription will stay active until the end of your current billing period. Learn how to cancel your subscription
No, books cannot be downloaded as external files, such as PDFs, for use outside of Perlego. However, you can download books within the Perlego app for offline reading on mobile or tablet. Learn how to download books offline
Perlego offers two plans: Essential and Complete
- Essential is ideal for learners and professionals who enjoy exploring a wide range of subjects. Access the Essential Library with 800,000+ trusted titles and best-sellers across business, personal growth, and the humanities. Includes unlimited reading time and Standard Read Aloud voice.
- Complete: Perfect for advanced learners and researchers needing full, unrestricted access. Unlock 1.5M+ books across hundreds of subjects, including academic and specialized titles. The Complete Plan also includes advanced features like Premium Read Aloud and Research Assistant.
We are an online textbook subscription service, where you can get access to an entire online library for less than the price of a single book per month. With over 1.5 million books across 990+ topics, we’ve got you covered! Learn about our mission
Look out for the read-aloud symbol on your next book to see if you can listen to it. The read-aloud tool reads text aloud for you, highlighting the text as it is being read. You can pause it, speed it up and slow it down. Learn more about Read Aloud
Yes! You can use the Perlego app on both iOS and Android devices to read anytime, anywhere — even offline. Perfect for commutes or when you’re on the go.
Please note we cannot support devices running on iOS 13 and Android 7 or earlier. Learn more about using the app
Please note we cannot support devices running on iOS 13 and Android 7 or earlier. Learn more about using the app
Yes, you can access Re-interpreting the Relationship Between Water and Urban Planning by Maria Chiara Pastore in PDF and/or ePUB format, as well as other popular books in Architecture & Urban Planning & Landscaping. We have over 1.5 million books available in our catalogue for you to explore.