![]()
1 Overview of the process of computer-assisted analysis
Computer-assisted qualitative data analysis consists of various consecutive phases, which are on the most general level: preparing data and creating a project file, coding the data, using the software to sort and structure the data and querying the data with the aim of discovering patterns and relations. The emphasis on coding will be different depending on the chosen methodological approach, and I will write more about it when explaining the various entities and tools that are at your disposal in ATLAS.ti in later chapters. The logic of the software, though, is built around coding. None of the analysis tools for querying the data can be used without the user having coded the data. In coding the data, you describe what is in the data. These might be people, artifacts, organizations, emotions, attitudes, actions, strategies, consequences of actions, contextual factors and the like. Depending on the chosen methodological approach, this may mean that you are tagging the data at a nominal level or that you are developing code labels based on a more detailed interpretation of data segments (see Chapter 5). Once the data are coded and a code system is developed, it can be interrogated (see Chapters 6 and 7). Both phases are described in more detail below.
Phase 1 description of the data — creation of a code system
The aim of descriptive-level analysis is to explore the data, to read or to look through them and to notice interesting things that you begin to collect during first-stage coding. This requires reading transcripts, field notes, documents, reports, newspaper articles, etc., viewing video material or images or listening to audio files. Generating word clouds and word lists may also be a starting point when you have lots of data. To capture the interesting things that you notice, you may write down notes, mark the segments you find interesting, write comments or, as is most common, attach labels (= coding). These labels are referred to as ‘codes’ in the software, for historic reasons. I will write more about this in Chapters 4 and 5. You may also think of them as ‘tags’. At this point in the analysis process, the labels can be descriptive or already conceptual, lower- or higher-order. Developing codes and a code system is a process, and the labels you create at this stage of the analysis process are likely to change. Thus, you do not have to worry too much whether a label is right or wrong. Reading further, you will very likely notice a few things that are like others you have noticed before. If they fit under a label that you already have, you apply it again. If an issue is similar but does not quite fit a tag that you already have, renaming it may allow you to subsume the data segments.
The labels do not have to be perfect yet. You can continue to collect more similar data segments and later, when you review them, it will be easier to think of better and more fitting labels to cover the substance of the material you have collected. The intellectual work that you do at this stage is the same as described in the past for manual ways of analysis. As Strauss and Corbin wrote in 1998:
As the researcher moves along with analysis, each incident in the data is compared with other incidents for similarities and differences. Incidents found to be conceptually similar are grouped together under a higher-level descriptive concept. (73)
The initial process of collecting interesting things (i.e. coding) can be manifold depending on the underlying research questions, research aim and overall methodology you are using. To name just a few of the various procedures that you will find in the literature:
- descriptive or topic coding (Miles et al., 2014; Richards and Morse, 2013; Saldaña, 2009; Wolcott, 1994)
- process coding (Bogdan and Biklen, 2007; Charmaz, 2002; Corbin and Strauss, 2008)
- initial or open coding (Charmaz, 2006; Corbin and Strauss, 2008; Glaser, 1978)
- emotion coding (Goleman, 1995; Prus, 1996)
- values coding (Gable and Wolf, 1993; LeCompte and Preissle, 1993)
- narrative coding (Cortazzi, 1993; Riessman, 2008)
- provisional coding (Dey, 1993; Miles and Hubermann, 1994).
Researchers may choose to follow just one of the suggested procedures or combine them. The things you collect in your data may include themes, emotions and values at the same time. You can code the data using deductively derived codes as in provisional coding; or you can develop codes inductively (e.g. initial or open coding) or abductively, which is often the case when developing categories. Some researchers develop about 40 codes, others a few hundred or even a few thousand. In this book, I give some answers for what to do with your list codes. Often there is a lack of methodological understanding of what a code is. The software does not explain it; it just offers functions to create new codes, to delete, to rename or to merge them. The metaphor of collecting helps to understand better that a properly developed code is more than just a descriptive label for a data segment and that it does not make sense to attach a new label to everything one notices. You learn more about this in Chapter 5.
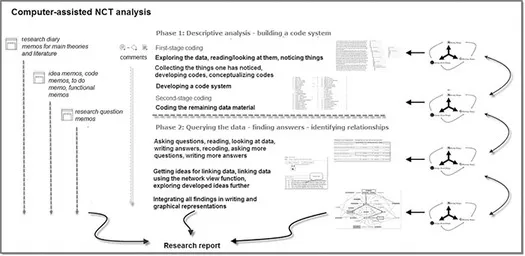
The aim of the first phase of coding is to develop a code list that describes the issues/aspects/phenomena/themes that are in the data, naming them and trying to make sense of them in terms of similarities and differences. This results in a structured code list which you can apply to the rest of the data during second-stage coding. Very likely the code list will need to be refined further and there will be a few more cycles of noticing and collecting until all the data are coded and the coding schema is fully developed. In parallel you can comment on data segments and begin to write memos.
Figure 1.1 The process of computer-assisted qualitative data analysis
Phase 2 querying data — finding answers — identifying relationships
At some point, all data are coded, and you can enter the next phase of analysis. So far, you have been working at the data level. The aim now is to look at the data from a different angle: the perspective of the research questions. Starting from one of your questions, you begin to query the data based on your coding. ATLAS.ti offers a variety of analysis tools such as the Code-Document Table, code co-occurrence analyses, the Query Tool and the networks. The results of queries can be displayed in the form of numbers, the coded quotations or as a visualization. However, the actual analysis takes place during the writing process by summarizing and interpreting the results. For this the ATLAS.ti memo function can be used. How to use memos is described throughout the book in various chapters. While writing comments as well as memos, you move the analysis further step by step, dig deeper, look at details and begin to understand how it all fits together.
When beginning to see how it all fits together, visualization tools like the network function in ATLAS.ti are used. Working with networks stimulates a different kind of thinking and allows further explorations. Networks can also be used as a means of talking with others about a finding or about an idea to be developed. Before you reach the last step of the analysis, several networks will probably have been drawn, redrawn, deleted and created anew. The aim is to integrate all the findings and to gain a coherent understanding of the phenomenon studied; or, if theory building was your aim, to visualize and to present a theoretical model.
The analytic process
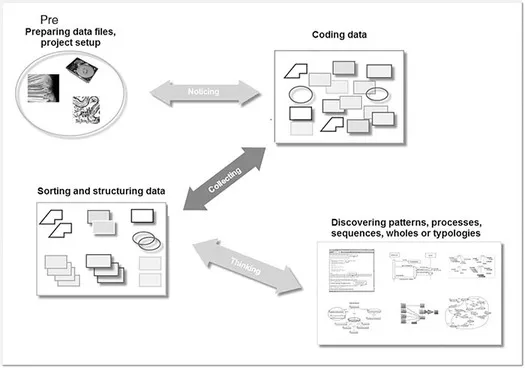
Analysis might proceed in a sequential manner, where you move directly from noticing to coding to discovering interesting insights as shown in Figure 1.2. However, unless you have a very structured and simple project like the analysis of an open-ended survey question, then this will seldom be possible.
Figure 1.2 The process from project set-up to discovery
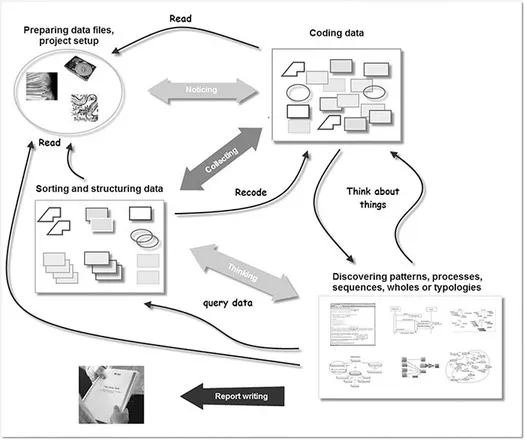
More likely is a recursive process where you move back and forth between noticing and collecting – for instance, when developing subcategories. You may also want to go back to noticing and recoding after already having discovered some relations and created networks. The visualization gives you a different angle on the data: it may be used to talk about your ideas with others, and then you may notice you have overlooked something and need to go back, rethink and recode. You may also decide that you need to collect some more data.
Figure 1.3 Analysis in most cases will be iterative and recursive
Real-life qualitative data analysis often looks as shown in Figure 1.3 – a bit messy but fascinating and exciting. Did you note the new element in Figure 1.3, the report? Usually there are deadlines for submitting a research report or your thesis or a paper. Memos are the building blocks for your report. If you follow the suggestions in Chapter 5, the transition from ATLAS.ti to writing your thesis or the result chapters of your thesis will run smoothly.
A third variation is to go about analysis in a holistic manner. If you get to a point where you cannot see the wood for the trees, or if you feel you simply cannot sit in front of a computer screen any longer, then it is time to look at the whole again. Take a printout of one or more transcripts. In summer, look for a delightful place outside; in winter, find a cozy spot in front of the fire. Have something to eat and drink and then spend some time reading your data from beginning to end in a sequential order, reminding yourself of the interview situation or other contexts. Do the same with videos or other types of data you may have. There is no need to sit in front of the computer all the time. Reading the data via a different medium, such as on good old-fashioned paper, is likely to give further insights. It may help you to see how it all fits together and how the results that you have so far can be integrated.
Freeman (2017) invites readers of her book Modes of Thinking for Qualitative Data Analysis to think outside the box of theoretical perspectives and methodologies and suggests five modes of approaching data analysis: categorical thinking, narrative thinking, dialectical thinking, poetical thinking and diagrammatical thinking. ATLAS.ti can support you in all five modes. The simplest to see are the implementation of the categorical mode (encoding data) and the implementation of the diagram mode (creating networks). The other approaches have more to do with how you think about the data. This may affect the types of code you use, but it is mainly about writing comments and memos (see, e.g., Skills training 5.7). Additionally, for narrative thinking, the Code-Document Table can be used to compare different narratives (see Skills Training 6.4). Hyperlinks can be useful when using dialectical thinking mode (see Skills Training 7.5). Seeing the implementation certainly requires some experience in dealing with ATLAS.ti, but I definitely recommend the book. When you’re ready, it can give you inspirations on how to think about your data.
Does my methodological approach fit a computer-assisted analysis?
You first need to decide what your objective is and what you want to achieve considering the research question that you want to find an answer for. Which methodological approach is most suitable? Are you interested in analyzing discourse, in gaining insights through a person’s life story and narrative or in developing theory, or can the research question(s) best be answered by conducting a survey including several open-ended questions, organizing a series of focus group discussions or going into the field and writing observational notes? If you are not skilled in an approach that you think is suitable, you have two choices: to learn it or to modify your research question so you can find answers using an approach you are familiar with.
The next question you need to ask is whether the methodological approach you are considering lends itself to coding. As the software cannot decide for you the meaningful units and concepts in your data, you need to ‘tell’ the computer what is relevant and meaningful given your research question. This is done by creating quotations and coding the data.
After deciding on a methodological approach, you may decide to use the ATLAS.ti iPad or Android for data collection (not covered in this book). You may decide to use ATLAS.ti to help with your literature review. Your literature review will in most...