eBook - ePub
Growing Cooler
The Evidence on Urban Development and Climate Change
- 150 pages
- English
- ePUB (mobile friendly)
- Available on iOS & Android
eBook - ePub
Growing Cooler
The Evidence on Urban Development and Climate Change
About this book
Based on a comprehensive study review by leading urban planning researchers, this investigative document demonstrates how urban development is both a key contributor to climate change and an essential factor in combating it—by reducing vehicle greenhouse gas emissions.
Trusted by 375,005 students
Access to over 1.5 million titles for a fair monthly price.
Study more efficiently using our study tools.
Information

1
Overview
The phrase “you can’t get there from here” has a new application. For climate stabilization, a commonly accepted target for the year 2050 would require the United States to cut its carbon dioxide (CO2) emissions by 60 to 80 percent below 1990 levels. Carbon dioxide levels have been increasing rapidly since 1990, and so would have to level off and decline even more rapidly to reach this target level by 2050. This publication demonstrates that the U.S. transportation sector cannot do its fair share to meet this target through vehicle and fuel technology alone. We have to find a way to sharply reduce the growth in vehicle miles driven across the nation’s sprawling urban areas, reversing trends that go back decades.
This publication is based on an exhaustive review of existing research on the relationship among urban development, travel, and the CO2 emitted by motor vehicles. It provides evidence on and insights into how much CO2 savings can be expected with compact development, how compact development is likely to be received by consumers, and what policy changes will make compact development possible. Several related issues are not fully examined in this publication. These include the energy savings from more efficient building types, the value of preserved forests as carbon sinks, and the effectiveness of pricing strategies—such as tolls, parking charges, and mileage-based fees—when used in conjunction with compact development and expanded transportation alternatives.
The term “compact development” does not imply high-rise or even uniformly high density, but rather higher average “blended” densities. Compact development also features a mix of land uses, development of strong population and employment centers, interconnection of streets, and the design of structures and spaces at a human scale.
THE BASICS
Scientific consensus now exists that greenhouse gas accumulations due to human activities are contributing to global warming with potentially catastrophic consequences (IPCC 2007). International and domestic climate policy discussions have gravitated toward the goal of limiting the temperature increase to 2°C to 3°C by cutting greenhouse gas emissions by 60 to 80 percent below 1990 levels. The primary greenhouse gas is carbon dioxide, and every gallon of gasoline burned produces about 20 pounds of CO2.
Driving Up CO2 Emissions
The United States is the largest emitter worldwide of the greenhouse gases (GHGs) that cause global warming. Transportation accounts for a full third of CO2 emissions in the United States, and that share is growing, rising from 31 percent in 1990 to 33 percent today. It is hard to envision a “solution” to the global warming crisis that does not involve slowing the growth of transportation CO2 emissions in the United States.
The Three-Legged Stool Needed to Reduce CO2 from Automobiles
Transportation CO2 reduction can be viewed as a three-legged stool, with one leg related to vehicle fuel economy, a second to the carbon content of the fuel itself, and a third to the amount of driving or vehicle miles traveled (VMT). Energy and climate policy initiatives at the federal and state levels have pinned their hopes on shoring up the first two legs of the stool, through the development of more efficient vehicles (such as hybrid cars) and lower-carbon fuels (such as biodiesel fuel). Yet a stool cannot stand on only two legs.
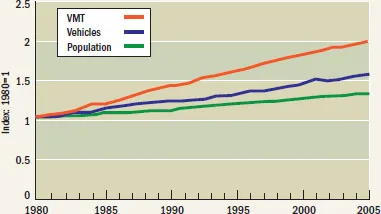
As the research compiled in this publication makes clear, technological improvements in vehicles and fuels are likely to be offset by continuing, robust growth in VMT. Since 1980, the number of miles Americans drive has grown three times faster than the U.S. population, and almost twice as fast as vehicle registrations (see Figure 1–1). Average automobile commute times in metropolitan areas have risen steadily over the decades, and many Americans now spend more time commuting than they do vacationing.
FIGURE 1–1
Growth of Population, Vehicle Registration, and VMT in the United States relative to 1980 Values
This raises some questions, which this report addresses. Why do we drive so much? Why is the total distance we drive growing so rapidly? And what can be done to alter this trend in a manner that is effective, fair, and economically benign?
The growth in driving is due in large part to urban development, or what some refer to as the built environment. Americans drive so much because we have given ourselves little alternative. For 60 years, we have built homes ever farther from workplaces, located schools far from the neighborhoods they serve, and isolated other destinations—such as shopping—from work and home. From World War II until very recently, nearly all new development has been planned and built on the assumption that people will use cars every time they travel. As a larger and larger share of our built environment has become automobile dependent, car trips and distances have increased, and walking and public transit use have declined. Population growth has been responsible for only a quarter of the increase in vehicle miles driven over the last couple of decades. A larger share of the increase can be traced to the effects of a changing built environment, namely to longer trips and people driving alone.
SOURCE: Federal Highway Administration (FHWA). “Vehicle Registrations, Fuel Consumption, and Vehicle Miles of Travel as Indices,” Highway Statistics 2005. Washington, D.C.: U.S. Department of Transportation, 2006, http://www.fhwa.dot.gov/policy/ohim/hs05/htm/mvfvm.htm.
FIGURE 1–2
Projected Growth in CO2 Emissions from Cars and Light Trucks
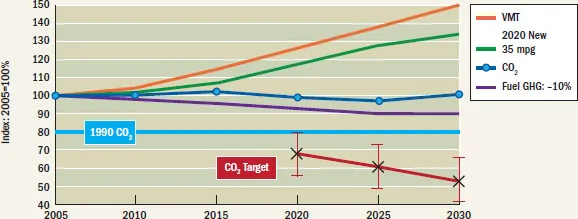
SOURCE: S. Winkelman (Center for Clean Air Policy) calculations based on ElA’s Annual Energy Outlook 2008 (Early Release) and the Energy Independence and Security Act of 2007.
As with driving, land is being consumed for development at a rate almost three times faster than population growth. This expansive development has caused CO2 emissions from cars to rise even as it has reduced the amount of forest land available to absorb CO2.
How Growth in Driving Cancels Out Improved Vehicle Fuel Economy
Conventional pollutants can be reduced in automobile exhaust with sophisticated emission control systems such as catalytic converters, on-board computers, and oxygen sensors. In contrast, CO2 is a fundamental end product of burning fossil fuels; there is no practical way to remove or capture it from moving vehicles. At this point in time, the only way to reduce CO2 emissions from vehicles is to burn less gasoline and diesel fuel.
An analysis by Steve Winkelman of the Center for Clean Air Policy, one of the coauthors of this publication, finds that CO2 emissions will continue to rise, despite technological advances, as the growth in driving is projected to overwhelm planned improvements in vehicle efficiency and fuel carbon content from the Energy Independence and Security Act of 2007 (U.S. Congress 2007). The act requires passenger vehicle fuel economy improvements to at least 35 miles per gallon (mpg) for new passenger vehicles by 2020, which would lead to a 34 percent increase in fleet-wide fuel economy by 2030 (green line in Figure 1–2). The act also sets renewable fuel requirements that Winkelman calculates would reduce lifecycle GHG emissions by 10 percent by 2025 (purple line). Absent growth in driving, these measures would reduce CO2 emissions from cars and light trucks by 23 percent below current levels.
Even when these more stringent standards for vehicles and fuels fully penetrate the market, however, transportation-related emissions still would far exceed target levels for stabilizing the global climate. The U.S. Department of Energy’s Energy Information Administration (EIA) forecasts a 48 percent increase in driving between 2005 and 2030 (orange line in Figure 1–2), outpacing the projected 23 percent increase in population (EIA 2008).1 The rapid increase in driving would overwhelm both the increase in vehicle fuel economy and the lower carbon fuel content required by the Energy Independence and Security Act of 2007. Carbon dioxide emissions from cars and light trucks would remain at 2005 levels (blue line), or 26 percent above 1990 levels (light blue line) in 2030. For climate stabilization, the United States must bring the CO2 level to approximately 33 percent below 1990 levels by 2030 to be on a path to a CO2 reduction of 60 to 80 percent by 2050 (red line).
As the projections show, the United States cannot achieve such large reductions in transportation-related CO2 emissions without sharply reducing the growth in the number of miles driven.
Changing Development Patterns to Slow Global Warming
Recognizing the unsustainable growth in driving, the American Association of State Highway and Transportation Officials (AASHTO), representing state departments of transportation, is urging that the growth of vehicle miles driven be cut in half. How does a growing country—one with 300 million residents and another 120 million on the way by mid-century—slow the growth of vehicle miles driven? Aggressive measures certainly are available, including imposing ever stiffer fees and taxes on driving and parking or establishing no-drive zones or days. Some countries are experimenting with such measures. However, many in this country would view these measures as punitive, given the reality that most Americans do not have a viable alternative to driving. The body of research surveyed here shows that much of the rise in vehicle emissions can be curbed simply by growing in a way that will make it easier for Americans to drive less. In fact, the weight of the evidence shows that, with more compact development, people drive 20 to 40 percent less, at minimal or reduced cost, while reaping other fiscal and health benefits.
How Compact Development Helps Reduce the Need to Drive
Better community planning and more compact development help people live within walking or bicycling distance of some of the destinations they need to get to every day—work, shops, schools, and parks, as well as transit stops. If they choose to use a car, trips are short. Rather than building single-use subdivisions or office parks, communities can plan mixed-use developments that put housing within reach of these other destinations. The street network can be designed to interconnect, rather than end in culs-de-sac and funnel traffic onto overused arterial roads. Individual streets can be designed to be “complete,” with safe and convenient places to walk, bicycle, and wait for the bus. Finally, by building more homes as condominiums, townhouses, or detached houses on smaller lots, and by building offices, stores and other destinations “up” rather than “out,” communities can shorten distances between destinations. This makes neighborhood stores more economically viable, allows more frequent and convenient transit service, and helps shorten car trips.
FIGURE 1–3
Housing within One-Quarter Mile of Commercial Centers for Contrasting Development Patterns in Seattle
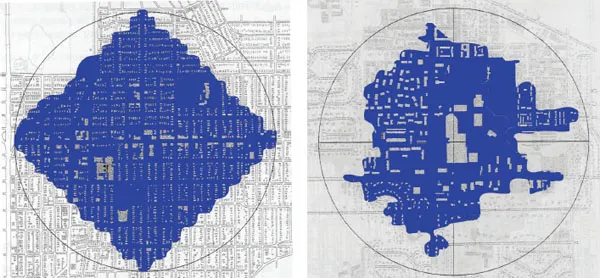
SOURCE: A.V. Moudon, P.M. Hess, M.C. Snyder, and K. Stanilov. “Effects of Site Design on Pedestrian Travel in Mixed-Use, Medium-Density Environments.” Transportation Research Record. Vol. 1578, 1997, pp. 48–55.
This type of development, which has seen a resurgence in recent years, goes by many names, including “walkable communities,” “new urbanist neighborhoods,” and “transit-oriented developments” (TODs). “Infill” and “brownfield” developments put unused parcels in urban areas to new uses, taking advantage of existing infrastructure and nearby destinations. Some “lifestyle centers” are now replacing single-use shopping malls with open-air shopping on connected streets with housing and office space above stores. And many communities have rediscovered and revitalized their traditional town centers and downtowns, often adding more housing to the mix. These varied development types are collectively referred to in this publication as “compact development” or “smart growth.”
How We Know That Compact Development Will Make a Difference: The Evidence
As these forms of development have become more common, planning researchers and practitioners have documented the fact that residents of compact, mixed-use, transit-served communities drive less than their counterparts in sprawling communities. Studies have looked at the issue from varying angles. They have:
FIGURE 1–4
Average Daily Vehicle Miles Traveled
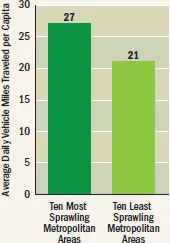
SOURCE: R. Ewing, R. Pendall, and D. Chen. Measuring Sprawl and Its Impact. Washington, D.C.: Smart Growth America/U.S. Environmental Protection Agency, 2002, p. 18.
- compared tra...
Table of contents
- Front Cover
- Book Title
- Copyright
- About Authors
- Acknowledgments
- Contents
- Chapter 1: Overview
- Chapter 2: Emerging Trends in Planning, Development, and Climate Change
- Chapter 3: The VMT/CO2/Climate Connection
- Chapter 4: The Urban Environment/VMT Connection
- Chapter 5: Environmental Determinism versus Self Selection
- Chapter 6: Induced Traffic and Induced Development
- Chapter 7: The Residential Sector
- Chapter 8: The Combined Effect of Compact Development, Transportation Investments, and Road Pricing
- Chapter 9: Policy and Program Recommendations
- Chapter: 10 Conclusion
- Notes
- References
- Related ULI Publications
Frequently asked questions
Yes, you can cancel anytime from the Subscription tab in your account settings on the Perlego website. Your subscription will stay active until the end of your current billing period. Learn how to cancel your subscription
No, books cannot be downloaded as external files, such as PDFs, for use outside of Perlego. However, you can download books within the Perlego app for offline reading on mobile or tablet. Learn how to download books offline
Perlego offers two plans: Essential and Complete
- Essential is ideal for learners and professionals who enjoy exploring a wide range of subjects. Access the Essential Library with 800,000+ trusted titles and best-sellers across business, personal growth, and the humanities. Includes unlimited reading time and Standard Read Aloud voice.
- Complete: Perfect for advanced learners and researchers needing full, unrestricted access. Unlock 1.5M+ books across hundreds of subjects, including academic and specialized titles. The Complete Plan also includes advanced features like Premium Read Aloud and Research Assistant.
We are an online textbook subscription service, where you can get access to an entire online library for less than the price of a single book per month. With over 1.5 million books across 990+ topics, we’ve got you covered! Learn about our mission
Look out for the read-aloud symbol on your next book to see if you can listen to it. The read-aloud tool reads text aloud for you, highlighting the text as it is being read. You can pause it, speed it up and slow it down. Learn more about Read Aloud
Yes! You can use the Perlego app on both iOS and Android devices to read anytime, anywhere — even offline. Perfect for commutes or when you’re on the go.
Please note we cannot support devices running on iOS 13 and Android 7 or earlier. Learn more about using the app
Please note we cannot support devices running on iOS 13 and Android 7 or earlier. Learn more about using the app
Yes, you can access Growing Cooler by Reid Ewing,Keith Bartholomew,Keith Bartholomew,Steve Winkelman,Jerry Walters,Don Chen in PDF and/or ePUB format, as well as other popular books in Architecture & Urban Planning & Landscaping. We have over 1.5 million books available in our catalogue for you to explore.