- 125 pages
- English
- ePUB (mobile friendly)
- Available on iOS & Android
eBook - ePub
Pedestrian- and Transit-Oriented Design
About this book
Explaining how to design spaces for pedestrians while also accommodating transit needs, this book is an excellent reference for students, public sector planners and officials, and private sector designers and developers seeking to make places more pedestrian- and transit-friendly. Written by a noted expert on pedestrian design and planning, this handbook contains examples of zoning codes from different localities.
Tools to learn more effectively

Saving Books

Keyword Search

Annotating Text

Listen to it instead
Information

CHAPTER 1
INTRODUCTION
THIS BOOK IS A HOW-TO MANUAL FOR CREATING GREAT PLACES that are walkable and transit oriented. It provides a mix of both the subjective and objective aspects of urban design and its role in creating walkable places, a key goal of smart growth. It begins with a discussion of the concepts espoused by the “founding fathers (and mothers)” of the urban design field, such giants as Gordon Cullen, Kevin Lynch, Jan Gehl, and Jane Jacobs. The book relies on hard data, such as consumer surveys, safety studies, and hedonic price studies. We find that the rhetoric of the great masters of urban design actually holds true in practice. Using both theory and data, we identify the most important aspects of urban design, explaining not only why good design matters but how it matters. Numerous photographs and drawings help support the assertions made and communicate ideas that are inherently visual.
This volume stands at the intersection of urban design and urban planning, leaning however toward urban design. Urban design differs from urban planning in scale, orientation, and treatment of space. The scale of design is primarily that of the street, sidewalk, park, or transit stop, as opposed to the larger region, community, or activity center. The orientation is aesthetic, as well as functional. The treatment of space in urban design is three-dimensional, with vertical elements being as important as horizontal elements in designing street space, park space, and other urban spaces. Urban planning, on the other hand, is customarily a two-dimensional activity (most plans, for example, are visually represented in plan view).
Building on work by the authors and others, this book ties together a rich urban design literature and empirical research in travel behavior, visual preference, real estate economics, and traffic safety.
This chapter provides an introduction to the topic. Chapter 2 outlines the urban design qualities that have been demonstrated to be central to pedestrian- and transit-oriented design. Chapters 3 through 5 follow with checklists of design features that would, ideally, be built into all transit-served areas. The features, which are illustrated with photos and graphics, fall into three classes: those deemed essential (chapter 3), those deemed highly desirable (chapter 4), and those deemed worthwhile but less essential (chapter 5). In a perfect world, all built environments would contain all these features. But alas, the world is not perfect and the resources of local governments, transit operators, and developers in charge of building that environment are not limitless. Because choices must be made, some sense of priority is required.

small-scale, three-dimensional design. | Dover, Kohl & Partners
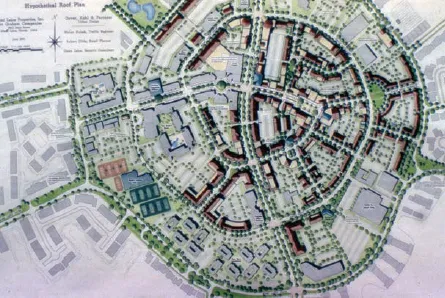
Large-scale, two-dimensional planning;
The book concludes with chapter 6, which offers some recent examples of local policies and codes that address the needs of pedestrians and transit users.
Demand for Walkable, Transit-Oriented Development
THE DEMAND FOR WALKABLE, TRANSIT-ORIENTED DEVELOPMENT is growing. Perhaps the best national gauge of this demand is the National Survey on Communities, conducted for the National Association of Realtors in 2004 and 2011 (Belden Russonello & Stewart 2004, 2011). In this survey, respondents were given a choice between two communities labeled A and B. Community A was described as having single-family homes on large lots, no sidewalks, shopping and schools located a few miles away, and no public transportation. (The 2004 survey included commutes of more than 45 minutes.) In contrast, community B was described as having a mix of denser housing, sidewalks, shopping and schools within walking distance, and nearby public transportation (and in 2004, commutes of less than 45 minutes).
In 2004, 55 percent of those surveyed expressed a preference for community B, the smart growth community with a shorter commute. Of those who were thinking of buying a house within the next three years, community B appealed to 61 percent. Commuting time had a significant influence on respondents’ preferences. About a third of the respondents said they would choose the smart growth design if commutes were comparable, while an additional quarter preferred such a design if it also meant being closer to work. By 2011, the percentage of all respondents preferring the smart growth community had risen to 56 percent, and this without a commuting advantage.
Bolstering these results, a national consumer survey by the global public relations company Porter Novelli found that 59 percent of U.S. adults now support the development of compact, walkable communities.1 Half would be interested in living in such communities (Handy et al. 2008). Levels of support were high among all groups except rural residents. More impressive than the absolute levels of support was the increase in support between survey years 2003 and 2005, a statistically significant 15 percent, which the authors attribute to increased media attention on sprawl and its costs.
FIGURE 1–1
Most Appealing Aspects of a Smart Growth Community
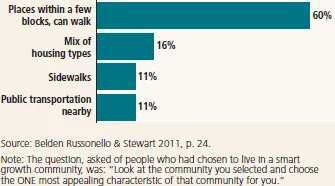
FIGURE 1–2
Americans Want to Walk More
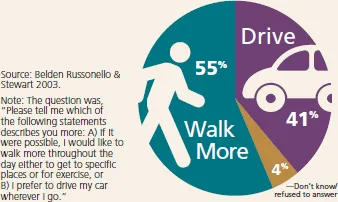
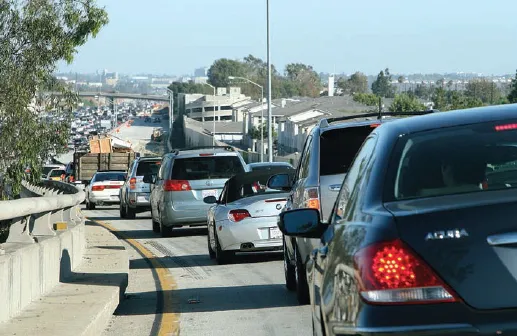
A third national survey, by the firm of Belden Russonello & Stewart (2003), found that 55 percent of Americans would drive less and walk more if they could. The survey question was, “Please tell me which of the following statements describes you more: A) If it were possible, I would like to walk more throughout the day either to get to specific places or for exercise, or B) I prefer to drive my car wherever I go.” When asked for solutions to traffic congestion, 35 percent cited increased transit service, whereas 31 percent thought communities should be designed to shorten trips to work and shop. Only 25 percent thought the solution to traffic congestion lay in highway expansion.
There are regional surveys that reached conclusions similar to these national surveys (Levine and Frank 2007; Levine, Inam, and Torng 2005; Lewis and Baldassare 2010; Metz and Below 2011; Morrow-Jones, Irwin, and Rowe 2004). Lucy and Phillips (2006) note that “more respondents prefer compact, mixed-use, transit accessible developments than the percentage of such developments being constructed” (p. 237). As outlined in the next section, this gap between supply and demand will likely grow in the future.
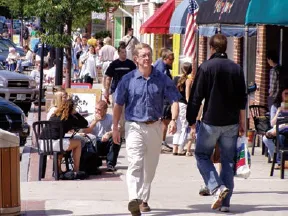
A preference for walking over driving (Durham, North Carolina). | Dan Burden
Even More So in the Future
WHEN IT COMES TO HOUSING DEMAND, DEMOGRAPHICS ARE DESTINY. As baby boomers become empty nesters and retirees, they are exhibiting a preference for compact, walkable neighborhoods. These trends will likely accelerate because the baby boom generation represents America’s largest generational cohort. By 2020, the number of individuals turning 65 years of age will skyrocket to more than 4 million per year. The Census Bureau estimates that between 2007 and 2050, the share of the U.S. population older than 65 will grow from 12.8 to 20.7 percent.
AARP (formerly the American Association of Retired Persons) has made transportation and quality-of-life matters among its top policy issues for the next decade. The organization is concerned because roughly one in five people over 65 does not drive at all, and more than half drive only occasionally (Bailey 2004). Older adults who lose their ability to drive remain at home most days, losing much of their independence and the ability to access essential services.
AARP surveys suggest that most people want to “age in place” (Bayer and Harper 2000). In most areas where older Americans are aging in place, alternatives to the automobile are limited. In fact, according to a national poll, only 45 percent of Americans over 65 live near public transportation (Mathew Greenwald & Associates 2003). The elderly are particularly inclined to walk when conditions are right. These findings, as well as the high cost of special transportation services, are reasons to make sure older people can easily access transit and live in safe, walkable communities.
Growth in households without children (including one-person households) will also affect living patterns dramatically. The percentage of households with children declined from 36 percent in 2000 to 33.5 percent in 2010. By 2025, only 28 percent of households will have children. Households without children are a natural market for urban living.
Beyond demographics, cultural changes are also at work in the housing market, particularly within generations X and Y, the two generations following the baby boomers. The children of the baby boom generation—referred to variously as echo boomers, millennials, and generation Y—have shown a preference for exciting, dense, urban places. A national study found that 57 percent of this cohort prefers small-lot housing and 53 percent values an easy walk from home to stores (Dittmar and Ohland 2004).
In 2011, a ULI survey of gen Y found 64 percent of respondents rated walkability “essential or preferable” (Lachman ...
Table of contents
- Cover
- Title Page
- Copyright
- About the Authors
- Contents
- Foreword
- Preface
- Acknowledgments
- 1 Introduction
- 2 Urban Design Qualities
- 3 Checklist of Essential Features
- 4 Checklist of Highly Desirable Features
- 5 Checklist of Worthwhile Additions
- 6 Conclusion
- References
Frequently asked questions
Yes, you can cancel anytime from the Subscription tab in your account settings on the Perlego website. Your subscription will stay active until the end of your current billing period. Learn how to cancel your subscription
No, books cannot be downloaded as external files, such as PDFs, for use outside of Perlego. However, you can download books within the Perlego app for offline reading on mobile or tablet. Learn how to download books offline
Perlego offers two plans: Essential and Complete
- Essential is ideal for learners and professionals who enjoy exploring a wide range of subjects. Access the Essential Library with 800,000+ trusted titles and best-sellers across business, personal growth, and the humanities. Includes unlimited reading time and Standard Read Aloud voice.
- Complete: Perfect for advanced learners and researchers needing full, unrestricted access. Unlock 1.4M+ books across hundreds of subjects, including academic and specialized titles. The Complete Plan also includes advanced features like Premium Read Aloud and Research Assistant.
We are an online textbook subscription service, where you can get access to an entire online library for less than the price of a single book per month. With over 1 million books across 990+ topics, we’ve got you covered! Learn about our mission
Look out for the read-aloud symbol on your next book to see if you can listen to it. The read-aloud tool reads text aloud for you, highlighting the text as it is being read. You can pause it, speed it up and slow it down. Learn more about Read Aloud
Yes! You can use the Perlego app on both iOS and Android devices to read anytime, anywhere — even offline. Perfect for commutes or when you’re on the go.
Please note we cannot support devices running on iOS 13 and Android 7 or earlier. Learn more about using the app
Please note we cannot support devices running on iOS 13 and Android 7 or earlier. Learn more about using the app
Yes, you can access Pedestrian- and Transit-Oriented Design by Reid Ewing,Keith Bartholomew,Keith Bartholomew in PDF and/or ePUB format, as well as other popular books in Architecture & Urban Planning & Landscaping. We have over one million books available in our catalogue for you to explore.