
- 176 pages
- English
- ePUB (mobile friendly)
- Available on iOS & Android
eBook - ePub
Statistical Method from the Viewpoint of Quality Control
About this book
The application of statistical methods in mass production make possible the most efficient use of raw materials and manufacturing processes, economical production, and the highest standards of quality for manufactured goods. In this classic volume, based on a series of ground-breaking lectures given to the Graduate School of the Department of Agriculture in 1938, Dr. Shewhart illuminated the fundamental principles and techniques basic to the efficient use of statistical method in attaining statistical control, establishing tolerance limits, presenting data, and specifying accuracy and precision.
In the first chapter, devoted to statistical control, the author broadly defines the three steps in quality control: specification, production, and inspection; then outlines the historical background of quality control. This is followed by a rigorous discussion of the physical and mathematical states of statistical control, statistical control as an operation, the significance of statistical control and the future of statistics in mass production.
Chapter II offers a thought-provoking treatment of the problem of establishing limits of variability, including the meaning of tolerance limits, establishing tolerance limits in the simplest cases and in practical cases, and standard methods of measuring. Chapter III explores the presentation of measurements of physical properties and constants. Among the topics considered are measurements presented as original data, characteristics of original data, summarizing original data (both by symmetric functions and by Tchebycheff's theorem), measurement presented as meaningful predictions, and measurement presented as knowledge.
Finally, Dr. Shewhart deals with the problem of specifying accuracy and precision — the meaning of accuracy and precision, operational meaning, verifiable procedures, minimum quantity of evidence needed for forming a judgment and more.
Now available for the first time in this inexpensive paperbound format, this highly respected study will be welcomed by mathematics students, engineers, researchers in industry and agriculture — anyone in need of a lucid, well-written explanation of how to regulate variable and maintain control over statistics in order to achieve quality control over manufactured products, crops, and data.
Tools to learn more effectively

Saving Books

Keyword Search

Annotating Text

Listen to it instead
Information
CHAPTER I
STATISTICAL CONTROL
The possibility of improving the economy of steel to the consumer is therefore largely a matter of improving its uniformity of quality, of fitting steels better for each of the multifarious uses, rather than of any direct lessening of its cost of production.1
JOHN JOHNSTON, Director of Research
United States Steel Corporation
Introduction. Three steps in quality control. Three senses of statistical control. Broadly speaking, there are three steps in a quality control process: the specification of what is wanted, the production of things to satisfy the specification, and the inspection of the things produced to see if they satisfy the specification. Corresponding to these three steps there are three senses in which statistical control may play an important part in attaining uniformity in the quality of a manufactured product: (a) as a concept of a statistical state constituting a limit to which one may hope to go in improving the uniformity of quality; (b) as an operation or technique of attaining uniformity; and (c) as a judgment. Here we shall be concerned with an exposition of the meaning of statistical control in these three senses and of the role that each sense plays in the theory and technique of economic control. But first we should consider briefly the history of the control of quality up to the time when engineers introduced the statistical control chart technique, which is in itself an operation of control.
SOME IMPORTANT HISTORICAL STAGES IN THE CONTROL OF QUALITY
Parts fitted 10,000 years ago
To attain a perspective from which to view recent developments, let us look at fig. 1. That which to a large extent differentiates man from animals is his control of his surroundings and particularly his production and use of tools. Apparently the human race began the fashioning and use of stone tools about a million years ago, as may be inferred from the recent discovery just north of London 2 of the crude stone implements shown at the left in fig. 1. Little progress in control seems to have been made, however, until about 10,000 years ago when man began to fit parts together in the fashion evidenced by the holes in the instruments of that day.
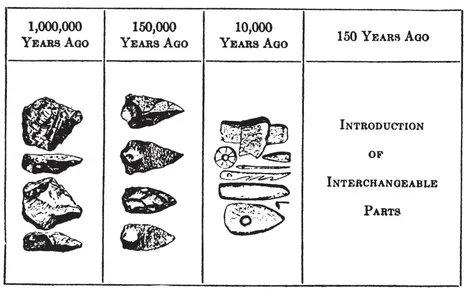
FIG. 1
Interchangeable parts—exact, 1787
Throughout this long period, apparently each man made his own tools, such as they were. As far back as 5000 years ago the Egyptians are supposed to have made and used interchangeable bows and arrows to a limited extent, but it was not until about 1787, or about a hundred and fifty years ago, that we had the first real introduction of the concept of interchangeable parts. Only yesterday, as it were, did man first begin to study the technique of mass production!
From the viewpoint of ideology, it is significant that this first step was taken under the sway of the concept of an exact science, according to which an attempt was made to produce pieceparts to exact dimensions. How strange such a procedure appears to us today, accustomed as we are to the use of tolerances. But as shown in fig. 2, it was not until about 1840 that the concept of a “go” tolerance limit was introduced and not until about 1870 that we find the “go, no-go” tolerance limits.3
“Go” tolerance limits, 1840; “go, no-go,” 1870
Why these three steps: “exact,” “go,” “go, no-go”? The answer is quite simple. Manufacturers soon found that they could not make things exactly alike in respect to a given quality; moreover, it was not necessary that they be exactly alike, and it was too costly to try to make them so. Hence by about 1840 they had eased away from the requirement of exactness to the “go” tolerance. Let us see how this worked. If we take, for example, a design involving the use of a cylindrical shaft in a bearing, one might insure interchangeability by simply using a suitable “go” plug gauge on the bearing and a suitable “go” ring gauge on the shaft. In this case, the difference between the dimensions of the two “go” gauges gave the minimum clearance. Such a method of gauging, however, did not fix the maximum clearance. The production man soon realized that a slack fit between a part and its “go” gauge might result in enough play between the shaft and its bearing to cause rejection, and for this reason he tried to keep the fit between the part and its “go” gauge as close as possible, thus involving some of the same kind of difficulties that had been experienced in trying to make the parts exactly alike. The introduction of the “go, no-go” gauge in 1870 was therefore a big forward step in that it fixed the upper and lower tolerance limits on each fitting part, thus giving the production man more freedom with a resultant reduction in cost. All he had to do was stay within the tolerance limits—he didn’t have to waste time trying to be unnecessarily exact.
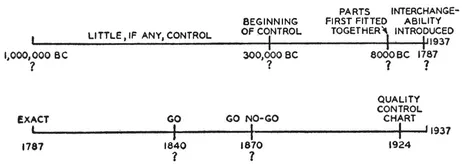
FIG. 2
Though this step was of great importance, something else remained to be done. The limits are necessarily set in such a way that every now and then a piece of product has a quality characteristic falling outside its specified range, and is therefore defective.
Defective parts; inspection
To junk or modify such pieces adds to the cost of production. But to find the unknown or chance causes of defectives and to try to remove them also costs money. Hence after the introduction of the go, no-go tolerance limits, there remained the problem of trying to reduce the fraction p of defectives to a point where the rate of increase in the cost of control equals the rate of increase in the savings brought about through the decrease in the number of rejected parts.
For example, in the production of the apparatus going into the telephone plant, raw materials are gathered literally from the four corners of the earth. More than 110,000 different kinds of pieceparts are produced. At the various stages of production, inspections are instituted to catch defective parts before they reach the place of final assembly to be thrown out there. At each stage, one must determine the economic minima for the sizes of the piles of defectives thrown out.
Destructive tests; necessity for sampling. How large a sample?
This problem of minimizing the percent defective, however, was not the only one that remained to be solved. Tests for many quality characteristics—strength, chemical composition, blowing time of a fuse, and so on—are destructive. Hence not every piece of product can be tested, and engineers must appeal to the use of a sample. But how large a sample should be taken in a given case in order to gain adequate assurance of quality?
The quality control chart, 1924
The attempt to solve these two problems gave rise to the introduction of the operation of statistical control involving the use of the quality control chart in 1924, and may therefore be taken as the starting point of the application of statistical technique in the control of the quality of a manufactured product in the sense here considered.
Why after 1900?
Why, you may ask, do we find, some one hundred and fifty years after the start of mass production, this sudden quickening of interest in the application of statistical methods in this field? There are at least two important reasons. First, there was the rapid growth in standardization. Fig. 3 shows the rate of growth in the number of industrial standardization organizations both here and abroad. The first one was organized in Great Britain in 1901. Then beginning in 1917 the realization of the importance of national and even international standards spread rapidly. The fundamental job of these standardizing organizations is to turn out specifications of the aimed-at quality characteristics. But when one comes to write such a specification, he runs into two kinds of problems: (1) minimizing the number of rejections, and (2) minimizing the cost of inspection required to give adequate assurance of quality in the sense discussed above. Hence the growth in standardization spread the realization of the importance of such problems in industry.
Second, there was a more or less radical change in ideology about 1900. We passed from the concept of the exactness of science in 1787, when interchangeability was introduced, to probability and statistical concepts which came into their own in almost every field of science after 1900. Whereas the concept of mass production of 1787 was born of an exact science, the concept underlying the quality control chart technique of 1924 was born of a probable science.
We may for simplicity think of the manufacturer trying to produce a piece of product with a quality characteristic falling within a given tolerance range as being analogous to shooting at a mark. If one of us were shooting at a mark and failed to hit the bull’s-eye, and some one asked us why, we should likely give as our excuse, CHANCE. Had some one asked the same question of one of our earliest known ancestors, he might have attributed his lack of success to the dictates of fate or to the will of the gods. I am inclined to think that in many ways one of these excuses is just about as good as another. Perhaps we are not much wiser in blaming our failures on chance than our ancestors were in blaming theirs on fate or the gods. But since 1900, the engineer has proved his unwillingness to attribute all such failures to chance. This represents a remarkable change in the ideology that characterizes the developments in the application of statistics in the control of quality.
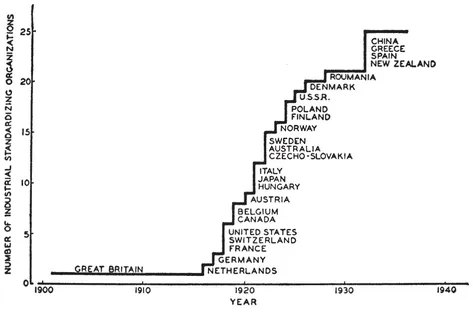
FIG. 3
Developments since 1870. With the introduction of the go, no-go tolerance limits of 1870, it became the more or less generally accepted practice to specify that each important quality characteristic X of a given piece of product should lie within stated limits L1 and L2, represented schematically in fig. 4. Such a specification is of the nature of an end requirement on the specified quality characteristic X of a finished piece of product. It provides a basis on which the quality of a given product may be gauged to determine whether or not it meets the specification. From this viewpoint, the process of specification is very simple indeed. Knowing the limits L1 and L2 within which it is desirable that a given quality characteristic X should lie, all we need to do is to put these limits in writing as a requirement on the quality of a finished product. With such a specification at hand, the next step is to make the measurements necessary to classify a piece of product as conforming or nonconforming to specification.
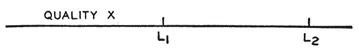
FIG. 4
Simple specification of go, no-go tolerance limits often unsatisfactory
At this point, however, two problems arise. Suppose that the quality under consideration, the blowing time of a fuse for example, is one that can be determined only by destructive tests. How can one give assurance that the quality of a fuse will meet its specification without destroying the fuse in the process? Or again, even where the quality characteristic can be measured without destruction, there is always a certain fraction p falling outside the tolerance limits. How can we reduce this nonconforming fraction to an economic minimum? A little reflection shows that the simple specification of the go, no-go tolerance limits (p. 3) is not sufficient in such instances from the viewpoint of economy and assurance of quality.
As was mentioned at the beginning of this chapter, we shall consider control from the viewpoints of specification, production, and inspection of quality, as is necessary if we are to understand clearly the role played by statistical the...
Table of contents
- Title Page
- Copyright Page
- FOREWORD - by W. Edwards Deming
- PREFACE
- Table of Contents
- CHAPTER I - STATISTICAL CONTROL
- CHAPTER II - HOW ESTABLISH LIMITS OF VARIABILITY?
- CHAPTER III - THE PRESENTATION OF THE RESULTS OF MEASUREMENTS OF PHYSICAL PROPERTIES AND CONSTANTS
- CHAPTER IV - THE SPECIFICATION OF ACCURACY AND PRECISION
- EPILOGUE
- SOME COMMENTS ON SYMBOLS AND NOMENCLATURE
- A CATALOG OF SELECTED DOVER BOOKS IN SCIENCE AND MATHEMATICS
Frequently asked questions
Yes, you can cancel anytime from the Subscription tab in your account settings on the Perlego website. Your subscription will stay active until the end of your current billing period. Learn how to cancel your subscription
No, books cannot be downloaded as external files, such as PDFs, for use outside of Perlego. However, you can download books within the Perlego app for offline reading on mobile or tablet. Learn how to download books offline
Perlego offers two plans: Essential and Complete
- Essential is ideal for learners and professionals who enjoy exploring a wide range of subjects. Access the Essential Library with 800,000+ trusted titles and best-sellers across business, personal growth, and the humanities. Includes unlimited reading time and Standard Read Aloud voice.
- Complete: Perfect for advanced learners and researchers needing full, unrestricted access. Unlock 1.4M+ books across hundreds of subjects, including academic and specialized titles. The Complete Plan also includes advanced features like Premium Read Aloud and Research Assistant.
We are an online textbook subscription service, where you can get access to an entire online library for less than the price of a single book per month. With over 1 million books across 990+ topics, we’ve got you covered! Learn about our mission
Look out for the read-aloud symbol on your next book to see if you can listen to it. The read-aloud tool reads text aloud for you, highlighting the text as it is being read. You can pause it, speed it up and slow it down. Learn more about Read Aloud
Yes! You can use the Perlego app on both iOS and Android devices to read anytime, anywhere — even offline. Perfect for commutes or when you’re on the go.
Please note we cannot support devices running on iOS 13 and Android 7 or earlier. Learn more about using the app
Please note we cannot support devices running on iOS 13 and Android 7 or earlier. Learn more about using the app
Yes, you can access Statistical Method from the Viewpoint of Quality Control by Walter A. Shewhart in PDF and/or ePUB format, as well as other popular books in Mathematics & Probability & Statistics. We have over one million books available in our catalogue for you to explore.