eBook - ePub
Voters' Vengeance
1990 Election in New Zealand and the Fate of the Fourth Labour Government
- 276 pages
- English
- ePUB (mobile friendly)
- Available on iOS & Android
eBook - ePub
Voters' Vengeance
1990 Election in New Zealand and the Fate of the Fourth Labour Government
About this book
The 1990 election in New Zealand produced the biggest landslide in 50 years, and
Voters' Vengeance uses comprehensive survey research to explore why New Zealand voters reacted in this way. The answers to over 2000 questionnaires allow the sophisticated analysis of voter behavior. The authors discuss the increasing volatility of New Zealand politics, the shifts in party commitment, reactions to Rogernomics and other Labour policies, the growth of third-party support, and leadership issues such as the environment, defense and the role of women. Tables, graphs and figures are an essential aspect of the study and they are carefully and clearly presented to show the changing character of New Zealand political opinion.
Trusted by 375,005 students
Access to over 1.5 million titles for a fair monthly price.
Study more efficiently using our study tools.
Information
1
Introduction: Asking the People
Every three years the New Zealand public is invited to share in the expression of raw emotion that for many years has climaxed the democratic contest for power between National and Labour. Moving around the parties’ election-night headquarters amidst that heady mix of sweat, alcohol and adrenalin, the TV cameras capture the moods of the party workers. It is a study in contrasts. In one venue there will be noise and elation; in the other there is subdued apprehension turning to despair as the electoral verdict becomes clear. Largely because of the first-past-the-post electoral system that New Zealand shares with the other Anglo-American democracies, electoral contests in New Zealand are essentially zero-sum, winner-takes-all occasions. There is thus little solace for the losers. So the climax of the evening, when the outcome can no longer be doubted, demands a stoical public concession of defeat by the loser to a jubilant but appropriately humble victor.
On election night, 27 October 1990, it was unusually early in the evening — before ten o’clock — when, not without a little difficulty, a crestfallen Mike Moore got in touch with an elated Jim Bolger to concede that his brief tenure as prime minister had come to an end, along with the Fourth Labour Government’s historic second term of office. By then the result of the election was clear, even if the exact details were not known. Labour’s loss was not unexpected — bets on Labour’s being re-elected had long since been off or translated into wagers on the size of National’s majority. Even so, the scale of Labour’s loss took many people by surprise. At the final tally of seats (after a recount had rescued Labour’s Fran Wilde in Wellington Central), Labour had plunged from 56 parliamentary places to 29, while National had risen from 41 to 67. Rubbing political salt into Labour’s electoral wounds, Jim Anderton, who had left Labour in 1989 to establish and lead the NewLabour Party, retained the 97th seat.
The 1990 election had resulted in the biggest spill of incumbent politicians since 1935. In all, 40 per cent of MPs were taking their seats for the first time after the election. And for Labour, it was the worst election since 1931. The parliamentary landslide scoured the ranks of even their senior politicians. Among those who lost their seats were twelve Labour ministers, both Labour whips and the speaker of the House of Representatives. Yet remarkably, there was some relief among Labour politicians and party leaders that the outcome had not been worse, as the party’s private polling had suggested it might be.
Although all elections are significant moments in political history, that of 1990 was the third in a series of three especially notable contests, beginning in 1984. There had been novelty and an added element of drama about the 1984 election. Called early by the beleaguered Prime Minister, Sir Robert Muldoon, it was the first snap election since 1951. In addition, there was a new aggressive player on the stage — Bob Jones and his New Zealand Party, giving explicit voice to the neo-liberal doctrines that have since spread across New Zealand and indeed the Western and developing worlds, but taking root most deeply in the English-speaking countries (Castles 1990). Attacked from two sides, National’s electoral foundations crumbled, seats toppled and the Muldoon Government fell. It was the first change of government in nearly a decade, National administrations (1949–57, 1960–72, 1975–84) being consistently more tenacious of office than Labour. Indeed, in the third of a century since the defeat of the pathbreaking First Labour Government (1935–49), Labour had held office for only two isolated single terms — 1957–60 and 1972–75. The defeat of the Muldoon Government was thus a signal event in the country’s politics.
Labour having won in 1984, the obvious question then was whether the eccentric rhythm of the electoral pendulum, with its long National and short Labour phases, would continue, thus restoring National to office in 1987, or whether Labour would snatch an historic second term. The 1987 election, however, gained its singularity from the radical nature of politics during the preceding three years (Boston & Holland 1987). For the Lange Labour Government had initiated a period of great political change — in government policies, in the functioning of the economy, in the direction of foreign policy, in the leadership of the Opposition and in the public’s general perception of the parties. Labour’s radicalism, however, was not a reaffirmation of the humanitarianism of the first Labour Government; quite to the contrary. In 1987 Labour was asking to be judged by new and largely unexpected criteria. Suddenly in office, its economic measures had ceased to be steered by its traditional Keynesian principles, and were guided instead by the resurgent doctrines of the free market and individualism. Labour had moved conspicuously to the right. Reassured by the new direction of Labour’s policies, Bob Jones allowed his New Zealand Party to collapse and encouraged those who had voted for it to shift their support to Labour in 1987. National meanwhile was left groping for a post-Muldoon direction and identity. How would Labour-inclined electors respond?
Certainly, by 1987, many of Labour’s traditional supporters were asking serious questions about the direction of the government’s economic policies. Nevertheless, Labour won again. It was an historic result. Only the middle-aged and elderly could remember the previous time that a Labour government had won two consecutive terms — in 1946. Yet there were signs of the hard electoral winter that was to follow. The Labour vote declined in many of the party’s heartland seats and the nonvote went up by more than 4 per cent. Some Labour politicians, while celebrating the outcome, were also noticeably nervous: ‘A lot of our folk have been hammered,’ admitted Mike Moore. ‘We’ve got to deliver,’ added Jim Anderton (Dominion Sunday Times, 16 August 1987). What was to be delivered and how had not been spelled out during the election campaign. However, there was an expectation that the government’s second term would follow a different mix of policies, with more emphasis on the broad area of social policies that would benefit Labour’s ‘traditional supporters’ and less emphasis on radical economic change. The government’s failure to fulfil that expectation doubtless contributed to its defeat in 1990.
Graph 1.1: Major Party Support 1984–1990, National and Labour
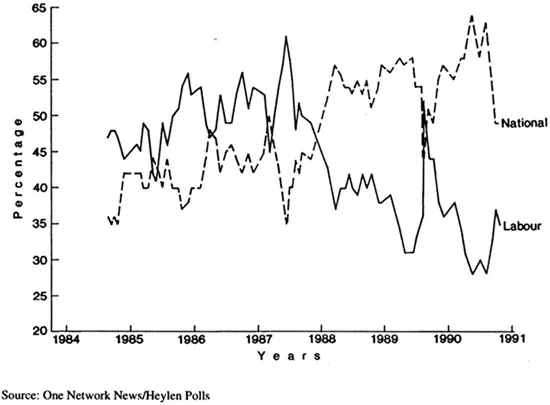
With the help of hindsight and public opinion polls, we can now say that Labour lost the 1990 election only a few months after its comfortable victory in August 1987. As graph 1.1 shows, the summer months of 1987–88 were a pivotal time for the electoral status of the Fourth Labour Government. Some time between the sharemarket crash in October 1987 and the outbreak early in the new year of public dispute between the then Prime Minister, David Lange, and the Minister of Finance, Roger Douglas, there was a massive and, as it turned out conclusive shift of public opinion against the government. In December 1987 Labour had still been just ahead of National in the opinion polls; by the end of February 1988 the graph lines of popular support for the two parties had crossed steeply and Labour trailed National by a wide margin. Through 1988 and into 1989 the electoral gap between the parties widened to a chasm, closing only briefly in September and October 1989 when Geoffrey Palmer replaced David Lange as prime minister, before splaying again to the point where, if the polls were to be believed, Labour’s parliamentary ranks after the election would have been reduced to an ineffectual rump. Stunned by the prospect, the Labour caucus took the drastic step in September 1990 of switching leaders on the eve of the election campaign, replacing Geoffrey Palmer with Mike Moore to try to improve the situation. As Peter Neilson, former MP for Miramar and minister in the outgoing Labour Government, has put it: ‘we made the second leadership decision on the question of annihilation. When the decision was made, objective analysis of polling said that we would have ended up with between 10 and 20 seats, probably at the lower rather than at the upper end.’ (McLeay 1991, 75) By the time the caucus acted, however, anything other than a National win in October would have confounded the structure of public opinion during the preceding two and a half years. Nevertheless, it had not been an inherently stable structure: 20 to 35 per cent of electors, many of whom had once had Labour sympathies, had presented themselves to the pollsters as ‘uncommitted’. Perhaps they could be enticed back to Labour. During the campaign Labour did indeed close the electoral gap between itself and National at a rate that alarmed National’s campaign tacticians (New Zealand Herald, 16 April 1991). However, on 27 October it took barely two hours of counting the votes to confirm the outcome that most people had been expecting.
Even when the result of an election is clear the reasons for it may be obscure, popular speculation notwithstanding. For the reasons are embedded in the decisions of individual electors about how (if at all) to mark the ballot paper. To explain the election result, we must therefore enquire into the nature of these myriads of decisions. Because it is not practicable to ask each individual (there were 2.2 million people on the electoral roll in 1990), the tool for such an enquiry is the sample survey, in which a group of people is chosen to ‘stand in’ for all electors. Provided the group is chosen by proper random methods and is of sufficient size and geographic spread, it will then comprise an accurate microcosm of the whole electorate: the group’s characteristics and voting behaviour will be representative of the whole population’s. By questioning our sample, we can listen to the voice of the electorate.
In research of this kind, the scope of the information sought is wide. It is assumed on theoretical grounds and has been confirmed by past research that voting behaviour is influenced by a great variety of factors (or variables), some long-term in their effect (such as family background and other social influences), others having a more immediate impact (the images of party leaders, the performance of the government, the policies of opposition parties). To take account of this variety and the sequential effect of long and short-term influences on how people vote, in their recent studies of British elections Rose and McAllister (1986; 1990) have proposed a ‘lifetime learning model’ of voting. In our analysis of the 1990 election we follow a similar approach; we use the data from survey research to attempt to unravel some of the tangled strands in the relationship between people and their politics. This purpose, and the role of theories about voting that guide the direction and scope of the enquiry, are what distinguish academic surveys from the public opinion polls which proliferate in the lead-up to an election. While there are some who question whether political behaviour is ever amenable to reliable enquiry by means of sample surveys (for example Dryzek 1990), this is for the present the most widely used way of pursuing the questions ‘who voted for what party and why?’.
There are methodological difficulties and dangers in the task. Drawing the representative sample of voters is perhaps the easiest part of the enquiry. Selecting the appropriate questions, which embrace the range of reasons for the millions of choices made on election day, is harder. In asking voters to give reasons for their choice of party we are often asking them about something they may not be at all clear on themselves. Open-ended questions, therefore, which would simply allow all respondents to speak for themselves, are of limited use. Instead, we must try to get voters to reconstruct their personal reasons for making their choice by providing them with appropriate cues. There are some well-known dangers in this. The researcher, by offering cues or predefined response options, may impose opinions and create attitudes which the respondent does not really hold; the voter may be presented with options which the researcher considers ought to be the reasons for voting, but which are not necessarily the real reasons. The researcher’s interpretation of the responses may then not be an accurate translation of the reasons why many people gave their answers in the first place. In asking questions about aspects of politics which the respondents themselves may not be clear about, we must accept that the resulting data, though ‘hard’ in form, will often also have ‘soft’ qualities, offering surprise, inconsistency or even downright obscurity. We are dealing with people, and the statistics cannot be cleansed entirely of the ambiguity of written or spoken communication.
Nevertheless, one of the great advantages of using survey data to analyse an election outcome is that although such data may be less accurate than the official statistics, they are able to reveal more of the dynamics of the electoral process as well as explore the reasons behind it. The published statistics lump large numbers of electors together, according to which party they voted for, giving a precise but static picture of the election result. We can compare the official record of how many votes a party got overall and in each electorate with other parties’ results and with past elections, and draw inferences about the movement of voters from party to party, or among individual electorates or categories of electorates (Johnston 1989; Vowles 1989); but only survey data which report what individuals said they did can remove most of the guesswork from this exercise and enable us to draw a more realistic map of the movements of individual voters from one election to the next.
In many respects, survey research is like sending a satellite into space. Sampling techniques enable us to direct our questionnaires to their proper destinations, to probe deeply into the electorate and to get back pictures we have not seen before. But the pictures will not always be clear, nor do they always match our expectations about what is ‘out there’. In political science as in astrophysics, the result of more information is both a better knowledge of reality and also a continuing debate about how to interpret the data at hand.
In fact very few academic survey researchers in New Zealand have sent such a ‘satellite’ into nationwide or near-nationwide orbit. Most electoral research, using sample survey techniques, has been confined to studies of single electorates or small groups of electorates (Bean 1986; Bean, Levine & Roberts 1991). In 1975 Levine and Robinson studied the election using a national postal survey, but their response rate was disturbingly low (Levine & Robinson 1976). Chapman used national survey data supplied by the Heylen Research Centre in a series of articles on the 1975 election, published in the National Business Review (Chapman 1976). And a few months before the 1981 election there was a nationwide telephone survey, with a limited number of questions (Gold 1985). Then immediately after the 1987 and 1990 elections, the authors of the present book launched two further electoral probes throughout New Zealand. The 1990 New Zealand Election Survey (NZES), by virtue of its sample size, response rate, national coverage, and its extensive range of questions, stands as the most comprehensive election survey conducted in New Zealand to date. Descriptions of the 1987 and 1990 surveys and sampling methods can be found in Appendix II.
Figure 1.1: The Variables Influencing Voting Choice in 1990
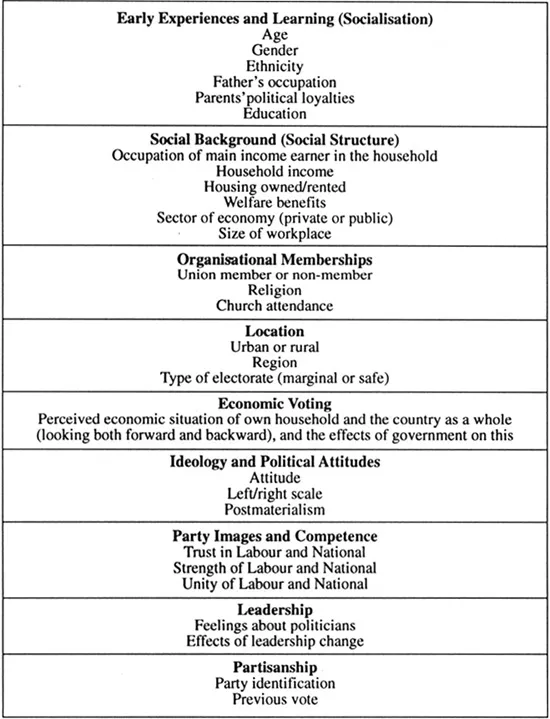
Figure 1.1 lists the main groups of variables employed in the 1990 New Zealand Election Survey (NZES), and the full text of the questionnaire may be found in Appendix III. The questions range from those seeking simple demographic information to those probing respondents’ attitudes to and opinions about a variety of current political issues and personalities. They take account first of people’s family and political backgrounds as they were growing up, because important formative experiences and learning processes introduce children and adolescents to politics before they are old enough to cast a vote. Different age groups or ‘age cohorts’ are often ‘socialised’ into particular sets of political opinions because of the times in which they grew up, or began voting. For example, there are people who grew up during the Depression of the 1930s and whose outlook was shaped by that experience; or, more recently, there are younger people who began voting in the 1980s under Labour, and who appear to have adopted stronger anti-nuclear sentiments than their older counterparts (Lamare 1991a). But as people mature, their demographic characteristics, occupational status, income, and a number of other social background or social structural variables may affect their political choices. The organisations they belong to, such as trade unions or churches, may also provide sites for political interaction and opinion formation. Even the area people live in may influence their voting choice, or whether they vote at all.
Meanwhile the political landscape is constantly changing. The period since 1984 in New Zealand has been one of major economic change. Unemployment has increased, economic growth has slowed, and many institutions, particularly those in the state sector, have been profoundly altered. While some New Zealanders have seen their living standards rise, more have felt them fall. In periods of economic decline and uncertainty, people frequently blame the government for their ills. Given this, we would expect that people who perceive the situation of their household and of the country as a whole to be worse, or likely to get worse, will be inclined to turn against the government. Thus voting may be in part economic, reflecting the voters’ verdict on the state of the economy and the governments’ economic performance. The size of the New Zealand economy shrank in real terms between 1987 and 1990, to the material detriment of most New Zealanders. Many observers and analysts have identified the economic recession as the major reason for Labour’s defeat.
In subsequent chapters, we shall explore the voters’ attitudes to a variety of political issues, seeking to identify the broad patterns of belief which lie behind those attitudes and to assess their effect on the political preferences of the voters. We shall investigate whether changes in political values are associated with support for new parties such as the Greens; and we shall examine voters’ general images of the major parties and their perceptions of the party leaders, in order to assess the varying strength of the political attachments which voters develop, and which lead some to habitually support a political party from election to election, while others switch from one party to another. By the end of the book, we will be in a position to weigh the relative contributions of all these factors toward the voting choices of individuals.
The need for such research has never been greater than in recent years. In the last decade, the relationship between governments and electors has been in a state of flux. There have been two changes of government, third parties have risen and fallen, an Alliance of minor parties has come together to fight in 1993, major party leaders have come and gone, ethnic, gender and environmental issues have sprung into focus and the international ideology of economic liberalism has transformed the agenda and objectives of New Zealand politics. In the aftermath of the election, the National Government imposed yet more dramatic change — somewhat surprising, given the National Party’s tradition of conservatism. National’s changes, moreover, have continued along the path of Labour’s economic policies, popularly known as ‘Rogernomics’, despite the severity of Labour’s electoral defeat on the basis of the same policies. Why then was Labour defeated, or more to the point, how could National win so decisively without promising a change in political direction? Should we be surprised that within only a few months of the decisive 1990 election result, the graph lines of party support had dramatically crossed again as electoral opinion continued on its fitful course? There is obviously still much to be learned about basic processes within New Zealand democracy, including the political reactions of the electorate, the capacity of a mass electorate to steer the direction of governments, or the ability of governments to shape the opinions and responses of the electorate. Survey research — asking the people, hopefully not just once but again and again in subsequent elections...
Table of contents
- Cover Page
- Title Page
- Copyright Page
- Contents
- List of Tables, Figures and Graphs
- Acknowledgements
- Preface
- 1 Introduction: Asking the People
- 2 Voters on the Move
- 3 The Structural Foundations of Voting Choice
- 4 The Decline of Political Participation
- 5 Issues and Voting
- 6 Rejecting Rogernomics?
- 7 The Material Conditions of Voting
- 8 The Welfare State
- 9 Environmentalism and the Greens
- 10 Political Trust and the NewLabour Party
- 11 A Mandate for Conservatism?
- 12 Party Unity and Leadership
- 13 Conclusion: Putting the Pieces Together
- Appendix I: Statistical Methods and Variable Scoring
- Appendix II: New Zealand Election Survey
- Appendix III: The Questionnaire
- Notes
- References
- Index
- Footnote
- Back Cover
Frequently asked questions
Yes, you can cancel anytime from the Subscription tab in your account settings on the Perlego website. Your subscription will stay active until the end of your current billing period. Learn how to cancel your subscription
No, books cannot be downloaded as external files, such as PDFs, for use outside of Perlego. However, you can download books within the Perlego app for offline reading on mobile or tablet. Learn how to download books offline
Perlego offers two plans: Essential and Complete
- Essential is ideal for learners and professionals who enjoy exploring a wide range of subjects. Access the Essential Library with 800,000+ trusted titles and best-sellers across business, personal growth, and the humanities. Includes unlimited reading time and Standard Read Aloud voice.
- Complete: Perfect for advanced learners and researchers needing full, unrestricted access. Unlock 1.5M+ books across hundreds of subjects, including academic and specialized titles. The Complete Plan also includes advanced features like Premium Read Aloud and Research Assistant.
We are an online textbook subscription service, where you can get access to an entire online library for less than the price of a single book per month. With over 1.5 million books across 990+ topics, we’ve got you covered! Learn about our mission
Look out for the read-aloud symbol on your next book to see if you can listen to it. The read-aloud tool reads text aloud for you, highlighting the text as it is being read. You can pause it, speed it up and slow it down. Learn more about Read Aloud
Yes! You can use the Perlego app on both iOS and Android devices to read anytime, anywhere — even offline. Perfect for commutes or when you’re on the go.
Please note we cannot support devices running on iOS 13 and Android 7 or earlier. Learn more about using the app
Please note we cannot support devices running on iOS 13 and Android 7 or earlier. Learn more about using the app
Yes, you can access Voters' Vengeance by Peter Aimer,Jack Vowles in PDF and/or ePUB format, as well as other popular books in Politics & International Relations & Political Campaigns & Elections. We have over 1.5 million books available in our catalogue for you to explore.