
- 317 pages
- English
- ePUB (mobile friendly)
- Available on iOS & Android
eBook - ePub
The Rich, The Poor, And The Taxes They Pay
About this book
This book presents a selection of essays on public finance, which is concerned with taxation, income maintenance, and social security, with emphasis on the analysis of policy alternatives to improve tax and transfer systems. It is useful for those who are interested in learning tax policy issues.
Trusted by 375,005 students
Access to over 1.5 million titles for a fair monthly price.
Study more efficiently using our study tools.
Information
Part One
Distribution of Tax Burdens
1.
The Rich, the Poor, and the Taxes they Pay*
The distribution of income has always been a hotly debated subject. Whatever has happened or is happening to the distribution of income, some people will always assert that the rich are getting a bigger share of the pie than is ‘fair’, while others will seek to show that this is not the case. Few people, however, bother to find out the facts, and fewer still understand what they mean.
The same applies to the tax system. Everybody knows that there are loopholes in the federal tax laws, but few realise that there are loopholes for persons at all income levels. Even fewer have a clear idea about the effects on the distribution of income of closing the more controversial loopholes. And only the experts know the state-local tax structure is in more urgent need of reform than the federal structure.
This chapter is intended to put these matters in perspective by summarising the available information. What has happened to the distribution of income before taxes in recent years, and how has the tax system modified it? What changes are needed to make it a fairer system? What would be the shape of a tax distribution that most Americans today might agree to be ‘fair’?
The Distribution of Income
Despite the proliferation of sophisticated economic data in this country, the United States government does not publish official estimates of the distribution of income. Such estimates were prepared by the Office of Business Economics for a period of years in the 1950s and early 1960s, but were discontinued because the sources on which they were based were acknowledged to be inadequate. We have data from annual field surveys of some 60,000 households conducted by the Bureau of the Census, as well as from the annual Statistics of Income prepared by the Internal Revenue Service from federal individual income tax returns. But both sources have their weaknesses: the Census Bureau surveys systematically understate income particularly in the top brackets; tax returns, on the other hand, understate the share received by low income recipients who are not required to file. Nevertheless, if used with care the two sources provide some interesting insights.
Before turning to the most recent period, it should be pointed out that a significant change in the distribution of pre-tax income occurred during the Great Depression and the Second World War. All experts who have examined the data agree that the distribution became more equal as a result of (a) the tremendous reductions in business and property incomes during the Depression, and (b) the narrowing of earnings differentials between low-paid workers and higher-paid skilled workers and salaried employees when full employment was re-established during the war. The most authoritative estimates, prepared by the late Selma Goldsmith and her associates, suggest that the share of personal income received by the top 5 per cent of the nation’s consumer units (including families and unrelated individuals) declined from 30 per cent in 1929 to 26.5 percent in 1935–36; the share of the top 20 per cent declined from 54.4 per cent to 51.7 per cent in the same period. The movement towards greater equality appears to have continued during the war up to about 1944. By that year, the share of the top 5 per cent had dropped another notch to 20.7 per cent, and of the top 20 per cent to 45.8 per cent.
The income concept used by these researchers did not include undistributed corporate profits, which are a source of future dividends or of capital gains for shareholders; if they had been included, the movement of the income distribution toward equality from 1929 to 1944 would have been substantially moderated, but by no means eliminated.1
The movement toward equality seems to have ended during the Second World War, at least on the basis of the available statistics. In 1952, for example, the share of the top 5 per cent was 20.5 per cent and of the top 20 per cent, 44.7 per cent. (The differences from the 1944 figures are well within the margin of error of these data, and can hardly be called significant.)
To trace what happened since 1952, we shift to the census data that provide the longest continuous and comparable income distribution series available to us. The beet way to appreciate the trend is to look at the figures for income shares at five-year intervals (table 1.1):
The figures indicate that the share of the top 5 per cent declined slightly between 1952 and 1957, and has remained virtually unchanged since 1957; the share of the top 20 per cent changed very little. Correspondingly, the shares of the groups at the bottom of the income scale (not shown in the table) also changed very little throughout the period.
Tax data are needed to push the analysis further. These data are better than the census data for our purposes, because they show the amount of realised capital gains and also permit us to calculate income shares after the federal income tax. But the great disadvantage of the tax data is that the bottom part of the income distribution is under-represented because of an unknown number of non-filers. Furthermore, the taxpayer unit is not exactly a family unit, because children and other members of the family file their own income tax returns if they have income, and a few married couples continue to file separate returns despite the privilege of income-splitting, which removed the advantage of separate returns with rare exceptions.
Table 1.1 : Before-Tax Income Shares, Census Data (per cent)
| Year | Top 5 per cent of families | Top 20 per cent of families |
| | ||
| 1952 | 18 | 42 |
| 1957 | 16 | 40 |
| 1962 | 16 | 42 |
| 1967 | 15 | 41 |
| 1972 | 16 | 41 |
| 1977 | 16 | 42 |
| 1981 | 15 | 42 |
Source: Bureau of the Census. Income includes transfer payments (e.g. social security benefits, unemployment compensation, welfare payments, etc.), but excludes capital gains, and single persons living alone.
There is really no way to get around these problems, but the tax data are too interesting to be abandoned because of these technicalities. So, we make an assumption that permits us to use at least the upper tail of the income distribution. The assumption is that the top 10 or 15 per cent of the nation’s tax units are for the most part similar to the census family units and the cases that differ represent roughly the same percentage of the total number of units each year. Because we have official Department of Commerce estimates of income (as defined in the tax code) for the country as a whole, the assumption enables us to compute income shares before and after tax for the top 1, 2, 5, 10 and 15 per cent of units annually for the entire post-war period.2
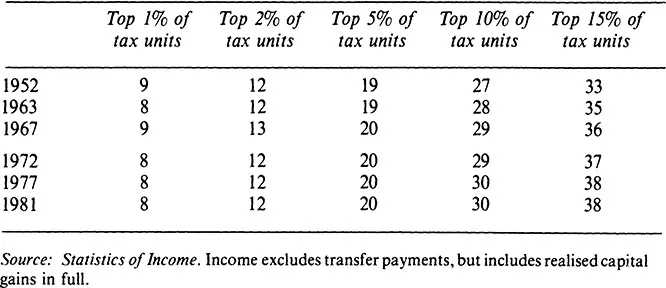
The tax series confirms much of what we learned from the census series, and adds a few additional bits of information besides. Table 1.2 presents the data for selected years beginning with the Korean War.
According to tax returns, the share of total income, including all realised capital gains, going to the top 1 and 2 per cent of the tax units were about the same for the entire period from 1952 to 1981. But the shares of the top 5, 10 and 15 percent—which, of course, include the top 1 and 2 per cent—all rose somewhat. These trends differ from the census figures which show that the entire income distribution was stable. By contrast, the tax data show that the 13 per cent of income recipients just below the top 2 per cent—this group reported incomes between $37,600 and $70,800 in 1981 increased their share of total income from 21 per cent to 26 per cent.
Table 1.2 : Before-Tax Income Shares, Tax Data (per cent)
If the figures are anywhere near being right, they suggest two significant conclusions: First, in recent years the very rich in our society have not enjoyed larger increased in incomes, as defined in the tax code, than the average income recipient. Although realised capital gains are included in the figures, they do not include non-reported sources such as tax-exempt interest and excess depletion; correction for these omissions would probably not alter the results very much, because the amounts involved are small relative to the total of reported incomes. Even a correction for the undistributed profits of corporations would not change the result very much because undistributed gross corporation profits have remained below 13 per cent of total reported income since 1950.
Second, a change in the income distribution occurred in what are sometimes called the ‘middle income’ classes. These classes consist of most of the professional people in this country (doctors, lawyers, engineers, accountants, college professors, etc.) as well as the highest paid members of the skilled labour force and white-collar workers. The increase in their share of total income from 21 per cent to 26 per cent represents a not insignificant improvement in their relative income status.
Clearly, this improvement in the income shares of the middle classes coud come only a...
Table of contents
- Cover
- Half Title
- Title
- Copyright
- Dedication
- Contents
- List of Tables
- List of Figures
- Foreword
- Introduction
- Part One. Distribution of Tax Burdens
- Part Two. Individual Income Taxation
- Part Three. Tax Issues
- Part Four. Financing a Federal System
- Part Five. Income Maintenance
- Part Six. Social Security
- Part Seven. Foreign Tax Systems
- Acknowledgements
- Index
Frequently asked questions
Yes, you can cancel anytime from the Subscription tab in your account settings on the Perlego website. Your subscription will stay active until the end of your current billing period. Learn how to cancel your subscription
No, books cannot be downloaded as external files, such as PDFs, for use outside of Perlego. However, you can download books within the Perlego app for offline reading on mobile or tablet. Learn how to download books offline
Perlego offers two plans: Essential and Complete
- Essential is ideal for learners and professionals who enjoy exploring a wide range of subjects. Access the Essential Library with 800,000+ trusted titles and best-sellers across business, personal growth, and the humanities. Includes unlimited reading time and Standard Read Aloud voice.
- Complete: Perfect for advanced learners and researchers needing full, unrestricted access. Unlock 1.5M+ books across hundreds of subjects, including academic and specialized titles. The Complete Plan also includes advanced features like Premium Read Aloud and Research Assistant.
We are an online textbook subscription service, where you can get access to an entire online library for less than the price of a single book per month. With over 1.5 million books across 990+ topics, we’ve got you covered! Learn about our mission
Look out for the read-aloud symbol on your next book to see if you can listen to it. The read-aloud tool reads text aloud for you, highlighting the text as it is being read. You can pause it, speed it up and slow it down. Learn more about Read Aloud
Yes! You can use the Perlego app on both iOS and Android devices to read anytime, anywhere — even offline. Perfect for commutes or when you’re on the go.
Please note we cannot support devices running on iOS 13 and Android 7 or earlier. Learn more about using the app
Please note we cannot support devices running on iOS 13 and Android 7 or earlier. Learn more about using the app
Yes, you can access The Rich, The Poor, And The Taxes They Pay by Joseph A. Pechman in PDF and/or ePUB format, as well as other popular books in Politics & International Relations & Politics. We have over 1.5 million books available in our catalogue for you to explore.