- 350 pages
- English
- ePUB (mobile friendly)
- Available on iOS & Android
eBook - ePub
Soy Protein And National Food Policy
About this book
Over the last twenty-five years, a healthy international business has developed in isolated soy protein food ingredients. Today, isolated soy proteins are used primarily as ingredients in processed meat products. They are also used as valuable sources of protein in medical nutritional products and in combination with dairy products around the world
Trusted by 375,005 students
Access to over 1.5 million titles for a fair monthly price.
Study more efficiently using our study tools.
Information
Chapter 1
Policy Implications
D. Gale Johnson*
I am not one who has believed or now believes that the world's demand for food will outrun its supply of food during the 20th Century. Thus I do not believe that for the foreseeable future international prices for the major sources of calories, such as grains, vegetable oils and sugar, will increase if such prices are adjusted for inflation. Yet I do support the development of soy protein food ingredients, including isolated soy proteins, and the fullest exploration of their economic feasibility.
Contrary to some widely held views, there has been general improvement in the nutrition and health status of the population of the developing countries. The improvement has not been uniform and it is possible that in some parts of Africa there has been deterioration in the food situation. This has certainly been the case where civil wars and insurrections have prevailed such as in Ethiopia, Sudan and Uganda. But for the area of the world for which there was great concern only a decade ago, namely Asia, there has been significant improvements in nutrition and health.
Table 1 includes data on food production per capita in the major regions of developing countries. In all regions, except Africa, there has been increases in per capita food production, modest in the near East and substantial in the Far East.
But the food available depends upon more than production; trade in food affects how much food is supplied to the domestic market. In the early 1960s Africa was a net exporter of food; at the end of the 1970s Africa was a major importer of food. In 1979-81 Africa imported 16 percent of the calories that it consumed. Consequently, as Table 2 indicates, there was no decline in per capita food supplies even in Africa during the 1960s and 1970s. Since much of the food imports by Africa during the 1979-81 period was provided by aid, it would have been clearly preferable had the increased food supply come from increased domestic agricultural productivity.
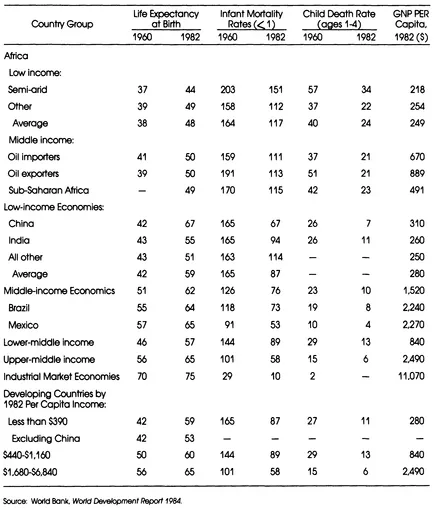
But the most striking evidence of improvement in health and nutrition, even in low income African countries, is the data on increases in life expectancy and declines in infant mortality and child death rates between 1960 and 1982. While the available data are subject to error, the data we do have indicate an increase in life expectancy in low income African countries of 7 to 10 years during the period. This is less than in other low income economies. The increase in life expectancy in India was 12 years and for all low income countries other than China and India the increase was about the same as for Africa, namely 8 years.
The declines in infant mortality and child death rates are clearly important indicators of improvement, though it is obvious that much remains to be accomplished. It is perhaps worth noting that in 1900 the infant mortality rate
Table 1 Estimated Indents of Food Production Per Capita for Developing Market Economies By Regions, 1966-85 (1961-65 = 100)
| Africa | Latin America | Near Easta | Far Easta | |
| 1966 | 96 | 101 | 101 | 94 |
| 67 | 98 | 104 | 103 | 97 |
| 68 | 100 | 103 | 103 | 101 |
| 69 | 100 | 104 | 103 | 103 |
| 1970 | 100 | 106 | 103 | 105 |
| 71 | 99 | 103 | 103 | 103 |
| 72 | 95 | 101 | 107 | 97 |
| 73 | 89 | 101 | 99 | 104 |
| 74 | 93 | 103 | 105 | 99 |
| 75 | 93 | 103 | 109 | 106 |
| 76 | 94 | 108 | 111 | 105 |
| 77 | 87 | 107 | 105 | 106 |
| 78 | 88 | 110 | 110 | 113 |
| 79 | 87 | 111 | 107 | 109 |
| 1980 | 87 | 112 | 107 | 110 |
| 81 | 86 | 113 | 108 | 115 |
| 82 | 86 | 113 | 108 | 112 |
| 83 | 80 | 110 | 106 | 118 |
| 84 | 81 | 110 | 106 | 118 |
| 85 | 86 | 115 | 112 | 120 |
1Source: FAO, FAO Production Yearbook, various issues.
aThe Near East includes Northern Africa and the Middle East.
bThe Far East includes South, Southeast and East Asia.
Table 2 Per Capita Dally Calorie Supply, World and Regions: 1961-63, 1969-71, 1979-81
| Calories per Capita Daily | |||
| Region/Group | 1961-63 | 1969-71 | 1979-81 |
| Developed countries | 3110 | 3280 | 3380 |
| Developed market economies | 3080 | 3260 | 3370 |
| N. America | 3270 | 3480 | 3610 |
| W. Europe | 3140 | 3290 | 3430 |
| Oceania | 3190 | 3280 | 3150 |
| Other developed | 2540 | 2770 | 2870 |
| Eastern Europe and U.S.S.R. | 3160 | 3320 | 3390 |
| Developing countries | 2000 | 2140 | 2350 |
| Developing market economies | 2080 | 2170 | 2330 |
| Africa | 2130 | 2180 | 2260 |
| Latin America | 2380 | 2510 | 2630 |
| Near East | 2290 | 2410 | 2840 |
| Far East | 1950 | 2030 | 2170 |
| Other developing | 1950 | 2190 | 2310 |
| Asian centrally planned economies | 1840 | 2080 | 2410 |
| World | 2350 | 2470 | 2620 |
Source: Mollett (1985, Table 1, p. 28).
in the United States was 160 per 1000 live births and that in the next 20 years it declined to 80 by 1920. Thus far all low income developing countries both the levels and rate of decline in infant mortality between 1960 and 1980 closely paralleled the U.S. experience in the first two dedades of this century.
The data included in Table 3 support the view that low income countries have generally improved their health and nutrition situation in recent decades. But the data also indicate that there is substantial room for further improvement. It is in this context that approaches that will permit lower cost means of improving food and nutrition merit our support.
Table 3 Life Expectancy at Birth, Infant Mortality Rates and Child Death Rate: Africa, 1960 and 1982
The chapters that follow subject the possibilities and prospects of isolated soy protein to a series of exhaustive analyses. It is unlikely ...
Table of contents
- Cover
- Half Title
- About the Book and Editor
- Title
- Copyright
- Contents
- Foreword
- PART ONE INTRODUCTION
- PART TWO CASE STUDIES
- PART THREE MICROECONOMIC CONSIDERATIONS
- PART FOUR TECHNICAL AND CONSUMER CONSIDERATIONS
Frequently asked questions
Yes, you can cancel anytime from the Subscription tab in your account settings on the Perlego website. Your subscription will stay active until the end of your current billing period. Learn how to cancel your subscription
No, books cannot be downloaded as external files, such as PDFs, for use outside of Perlego. However, you can download books within the Perlego app for offline reading on mobile or tablet. Learn how to download books offline
We are an online textbook subscription service, where you can get access to an entire online library for less than the price of a single book per month. With over 1.5 million books across 990+ topics, we’ve got you covered! Learn about our mission
Look out for the read-aloud symbol on your next book to see if you can listen to it. The read-aloud tool reads text aloud for you, highlighting the text as it is being read. You can pause it, speed it up and slow it down. Learn more about Read Aloud
Yes! You can use the Perlego app on both iOS and Android devices to read anytime, anywhere — even offline. Perfect for commutes or when you’re on the go.
Please note we cannot support devices running on iOS 13 and Android 7 or earlier. Learn more about using the app
Please note we cannot support devices running on iOS 13 and Android 7 or earlier. Learn more about using the app
Yes, you can access Soy Protein And National Food Policy by F. H. Schwarz,Marshall Marcus,F J Schwarz in PDF and/or ePUB format, as well as other popular books in Biological Sciences & Biology. We have over 1.5 million books available in our catalogue for you to explore.