This book provides a step-by-step guide on how to use various publicly available remotely sensed time series data sources for environmental monitoring and assessment. Readers will learn how to extract valuable information on global changes from a 20-year collection of ready-to-use remotely sensed data through the free open statistical software R and its geographic data analysis and modeling tools. The case studies are from the Mediterranean region—a designated hot spot regarding climate change effects. Each chapter is dedicated to specific remote sensing products chosen for their spatial resolution. The methods used are adapted from large-scale to smaller-scale problems for different land cover areas.
Features
Includes real-world applications of environmental remotely sensed data
Analyzes the advantages and restrictions of each data source
Focuses on a wide spectrum of applications, such as hydrology, vegetation changes, land surface temperature, fire detection, and impacts
Includes R computer codes with explanatory comments and all applications use only freely available remotely sensed data
Presents a step-by-step processing through open source GIS and statistical analysis software
Advanced Environmental Monitoring with Remote Sensing Time Series Data and R describes and provides details on recent advances concerning publicly available remotely sensed time series data in environmental monitoring and assessment. This book is a must-have practical guide for environmental researchers, professionals, and students.
Trusted by 375,005 students
Access to over 1.5 million titles for a fair monthly price.
CHAPTER 1 Environmental Application of Medium to High Resolution Remotely Sensed Data
Nikolaos Koutsias
1.1 INTRODUCTION: BACKGROUND ON THE SPECTRAL INFORMATION OF MEDIUM TO HIGH RESOLUTION SENSORS
Landsat Series
The Landsat series has a long history of data capture starting with the launch of Landsat 1 on July 23, 1972, with the Multispectral Scanner (MSS) onboard (originally known as Earth Resources Technology Satellite [ERTS]). Since that time, Landsat satellites have been taking repetitive images of Earth’s surface at continental scale, thus creating a huge historical archive that can be used to reconstruct the past (Nioti, Dimopoulos, and Koutsias 2011). Landsat 1, 2, and 3 carried the MSS, whereas Landsat 4 and 5 carried the onboard Thematic Mapper (TM), an advanced multispectral scanning radiometer that had higher spatial and spectral resolution than Landsat 1–3 and an improved geometric accuracy. Following the failure of Landsat 6, Landsat 7 was successfully launched on April 15, 1999, carrying the Enhanced Thematic Mapper Plus (ETM+). ETM+ data offer seven bands as TM which cover the visible, near, short-wave, and thermal infrared part of the electromagnetic spectrum and additionally a high resolution panchromatic band (for the first time in the Landsat series). The spatial resolution ranges from 15 to 60 meters.
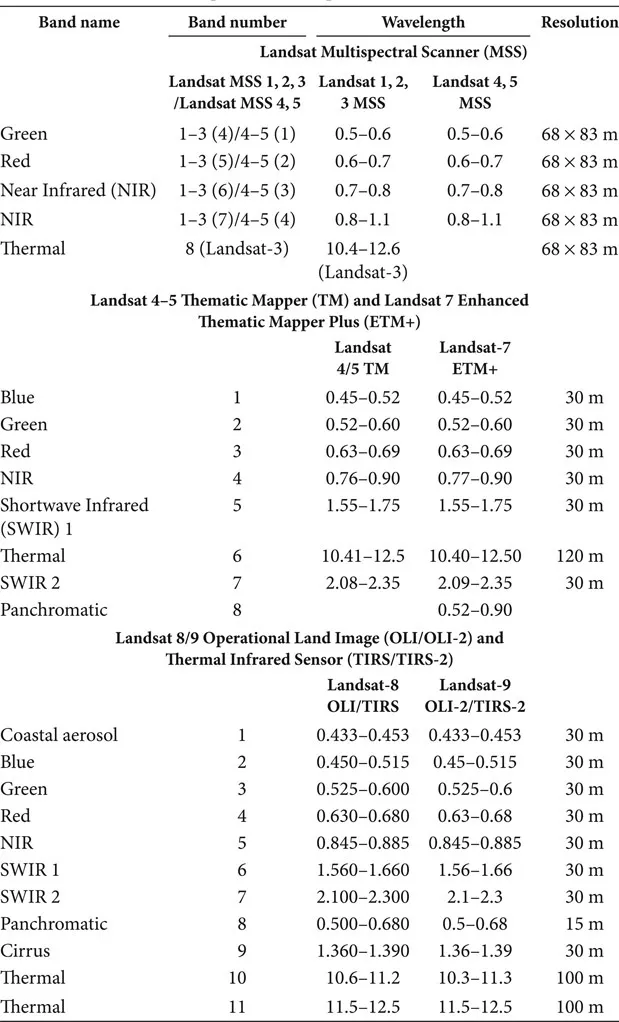
Landsat 8 (OLI, Operational Land Imager, and TIRS, Thermal Infrared Sensor) was launched on February 11, 2013, and has three new bands along with two additional thermal bands. Specifically, two spectral bands correspond to (i) a deep blue visible channel (band 1) specifically designed for water resources and coastal zone investigation, and (ii) a new infrared channel (band 9) for the detection of cirrus clouds. Additionally, a new Quality Assurance band is also included with each data product providing information on the presence of features such as clouds, water and snow. Finally, the TIRS instrument collects two spectral bands in the thermal infrared region of the wavelength as compared to a single band on the previous TM and ETM+ sensors (http://landsat.usgs.gov/). Finally, the new Landsat-8 OLI sensor has a higher radiometric resolution of 16-bit as compared to the 8-bit resolution provided by Landsat-7. This enhanced feature of Landsat-8 may enable greater sensitivity and reliability in the mapping and monitoring of burned areas. The Landsat spectral band specifications, including the upcoming Landsat-9, are listed in Table 1.1, while graphically are presented in Figure 1.1.
Table 1.1 The Landsat spectral bands specifications
Sentinel-2 Series
European Space Agency (ESA) is currently developing a new family of missions called Sentinels, which includes seven missions providing radar and super-spectral imaging for land, ocean, and atmospheric monitoring. Each Sentinel mission is based on a constellation of two satellites to revisit the coverage requirements and provide robust data sets for Copernicus Services. Among them Sentinel-2 is a polar-orbiting, multispectral high resolution imaging mission that comprises a constellation of two twin polar-orbiting satellites (Sentinel-2A and Sentinel-2B) placed in the same sun synchronous orbit, phased at 180 degrees to each other. Sentinel-2A was launched on June 23, 2015, and Sentinel-2B followed on March 7, 2017. The two sensors provide satellite data every five days at the equator under cloud-free conditions to monitor vegetation, soil and water cover, inland waterways, and coastal areas.
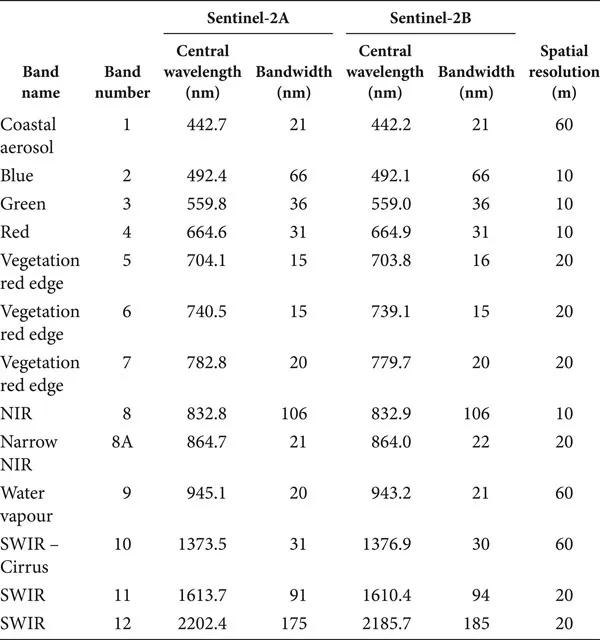
Sentinel-2 carries an optical instrument payload that samples 13 spectral bands at 10 m (four bands), at 20 m (six bands), and at 60 m (three bands) spatial resolution with an orbital swath width of 290 km. The twin satellites of Sentinel-2 continue data collection of SPOT (Satellite Pour l’Observation de la Terre) and LANDSAT-type image data, contributing thus to ongoing multi-spectral observations and used for various applications including among others land management, agriculture and forestry, disaster control, humanitarian relief operations, risk mapping, and security concerns.
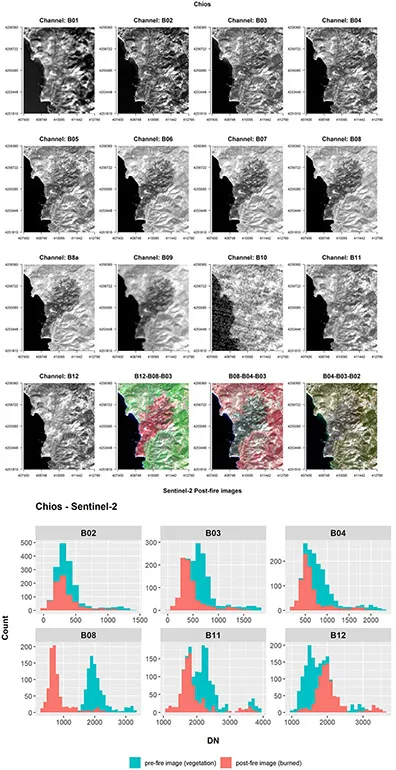
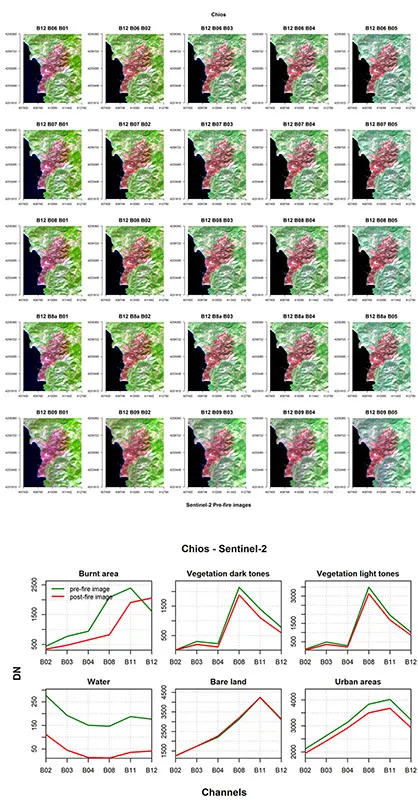
Sentinel-2, among other improved features over the more classical Landsat and SPOT satellite sensors, has a few red-edge bands (5, 6, and 7, although band 7 overlaps with NIR band 8) and a narrow NIR band. This unique feature of the Sentinel-2 sensor provides more capabilities especially for studies concerning vegetation and therefore also monitoring burned surfaces. Actually, red-edge spectral indices based on B5 and B7/B8 showed the highest suitability for burn severity discrimination (Fernández-Manso, Fernández-Manso, and Quintano 2016). Additionally, based on Huang et al. (2016), the most suitable Multi-Spectral Instrument (MSI) bands to detect burned areas are the 20 m near-infrared, shortwave infrared, and red-edge bands, while the performance of the spectral indices varied with location. The Sentinel-2 spectral band specifications are listed in Table 1.2, while all original spectral channels and RGB composites that arise from the correspondence of red to SWIR channel, green to NIR channels, and blue to visible channels, that enhance the discrimination of burned surfaces, are provided in Figure 1.2.
Table 1.2 The Sentinel-2 spectral bands specifications
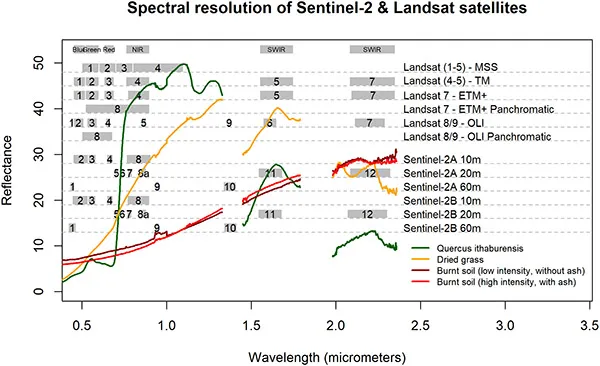
A diagram showing comparatively the spectral bands of Landsat and Sentinel-2 satellite sensors (excluding the thermal bands) along with some spectral curves captured by a portable field spectroradiometer (ASD FieldSpec® 4 Hi-Res) of vegetated, dry-vegetated, and burned areas is presented in Figure 1.1.
FIGURE 1.1 Position of the spectral bands (excluding the thermal) of Landsat and Sentinel-2 satellite sensors in the electromagnetic spectrum along with some spectral curves captured by a portable field spec-troradiometer (ASD FieldSpec® 4 Hi-Res) of vegetated, dry-vegetated, and burned areas.
Spectral Properties of Burned Surfaces: The Basis of Their Assessment and Monitoring
The spectral information of the objects in remote sensing is depicted in the spectral signatures or spectral response curves which is the interaction between the objects and the electromagnetic radiation. The spectral information of the objects is the basis of the remote sensing, and depending on how well the objects are spectrally separated they can be successfully mapped and monitored with satellite remote sensing data.
The spectral properties of burned surfaces have been studied and explored very well in Landsat satellite images, and their spectral patterns are very well known from many studies (Pereira et al. 1997). Two main spectral patterns have been reported; one that is defined by the spectral behavior in the visible channels and one that is defined by the infrared channels. These spectral
FIGURE 1.2 Spectral channels of Sentinel-2 sensor along with few RGB color composites (left upper panel), RGB color composites from SWIRNIR-Visible channels (right upper panel), histogram data plots of burned (post-fire image) vs. non-burned samples (pre-fire image) (left lower panel), and spectral signatures plots of various land cover types in the pre- and post-fire Sentinel-2 image (right lower panel). The two lower graphs concern only the B02, B03, B04, B08, B11, and B12 channels.
patterns have been observed in several studies and are almost identical with the spectral behavior of burned areas in similar environments (Koutsias and Karteris 1998, 2000; Koutsias, Mallinis, and Karteris 2009; Koutsias et al. 2013). More specifically, in the visible part of the electromagnetic spectrum the spectral signal of burned surfaces is similar to the spectral signal of vegetation in the pre-fire satellite image. Different studies carried out in the visible region indicated a varied behavior of burned areas depending on the type of affected vegetation, severity of burning, etc. (Arino et al. 2001; Pereira et al. 1997). More recently, Amos, Petropoulos, and Ferentinos (2019) concluded that the visible part of the electromagnetic spectrum was not well suited to discern burned from unburned land cover while the NBRb12 (Normalized Burn Ratio) (shortwave infrared 2: SWIR 2) produced the best results for detecting burned areas.
In addition to the visible part of the electromagnetic spectrum, a strong decrease in reflectance of burned surfaces is observed in the near-infrared part of the electromagnetic spectrum. The destruction of leaf cell structure, which reflects large quantities of incident solar radiation, is responsible for the reduction of the spectral signal of burned surfaces. Therefore, burned areas are expected to have lower reflectance in near-infrared bands than those of healthy vegetation. Many studies verify this spectral behavior of burned surfaces. In the near-infrared region the reflectance of burned surfaces is significantly lower than that of non-burned vegetation (Arino et al. 2001; Pereira et al. 1997). In contrast to near infrared, an increase in reflectance of burned surfaces is observed in the shortwave infrared that corresponds to Landsat TM or ETM+ band 7 or Sentinel-2 band 12. Burned areas are expected to have higher reflectance in shortwave infrared bands than those of healthy vegetation, due to the replacement of the vegetation layer with charcoal that reduces the water content which absorbs the radiation in this spectral region. Additionally, the spectral signal of burned surfaces in the SWIR region of the electromagnetic spectrum, that corresponds to Landsat TM or ETM+ band 5 or Sentinel-2 band 11, occasionally and depending on the vegetation affected may be the same between the pre- and post-fire images or may decrease especially if the fire-affected vegetation is dry.
1.2 LANDSAT ENVIRONMENTAL APPLICATIONS: RECONSTRUCTION OF FIRE HISTORY
There is a long history of mapping burned areas using satellite images of multiple resolutions either at research level to develop and/or improve the methods to map them or to create operational products at global scale (Chuvieco et al. 2019). Maps of fire occurrence can improve our understanding for the protection and restoration of fire-affected n...
Table of contents
Cover
Half Title
Title
Copyright
Contents
Preface
Authors
Introduction
Chapter 1 Environmental Applications of Medium to High Resolution Remotely Sensed Data
Chapter 2 Environmental Applications of Medium Resolution Remote Sensing Imaging
Chapter 3 Environmental Applications of Low Resolution Remotely Sensed Data
Chapter 4 Processing Remotely Sensed Data
Conclusions
INDEX
Frequently asked questions
Yes, you can cancel anytime from the Subscription tab in your account settings on the Perlego website. Your subscription will stay active until the end of your current billing period. Learn how to cancel your subscription
No, books cannot be downloaded as external files, such as PDFs, for use outside of Perlego. However, you can download books within the Perlego app for offline reading on mobile or tablet. Learn how to download books offline
Perlego offers two plans: Essential and Complete
Essential is ideal for learners and professionals who enjoy exploring a wide range of subjects. Access the Essential Library with 800,000+ trusted titles and best-sellers across business, personal growth, and the humanities. Includes unlimited reading time and Standard Read Aloud voice.
Complete: Perfect for advanced learners and researchers needing full, unrestricted access. Unlock 1.5M+ books across hundreds of subjects, including academic and specialized titles. The Complete Plan also includes advanced features like Premium Read Aloud and Research Assistant.
Both plans are available with monthly, semester, or annual billing cycles.
We are an online textbook subscription service, where you can get access to an entire online library for less than the price of a single book per month. With over 1.5 million books across 990+ topics, we’ve got you covered! Learn about our mission
Look out for the read-aloud symbol on your next book to see if you can listen to it. The read-aloud tool reads text aloud for you, highlighting the text as it is being read. You can pause it, speed it up and slow it down. Learn more about Read Aloud
Yes! You can use the Perlego app on both iOS and Android devices to read anytime, anywhere — even offline. Perfect for commutes or when you’re on the go. Please note we cannot support devices running on iOS 13 and Android 7 or earlier. Learn more about using the app
Yes, you can access Advanced Environmental Monitoring with Remote Sensing Time Series Data and R by Alexandra Gemitzi,Nikolaos Koutsias,Venkat Lakshmi in PDF and/or ePUB format, as well as other popular books in Biological Sciences & Environmental Science. We have over 1.5 million books available in our catalogue for you to explore.