- 262 pages
- English
- ePUB (mobile friendly)
- Available on iOS & Android
eBook - ePub
Airline Finance
About this book
This title was first published in 2002: The purpose of this book is to provide, as far as possible, a broad understanding of all areas of airline finance. It is intended to be suitable for both those in the industry without any financial background and newcomers to the industry who may have some knowledge of finance.
Tools to learn more effectively

Saving Books

Keyword Search

Annotating Text

Listen to it instead
Information
1 Industry Financial Performance
1.1 World airline financial results
The airline industry has experienced seven years of good profitability, enjoying the benefits of a relatively long world economic upswing between 1994 and 2000. This followed its emergence from four to five years of large financial losses, following the Gulf War and subsequent economic recession. Cumulative net losses of the world’s scheduled airlines amounted to US$ 20.3 billion between 1990 and 1993, but this was followed by almost $40 billion in net profits between 1995 and 2000. This highlights the cyclical nature of the industry, and the need to treat with caution comments after the Gulf War recession about the continued ability of the industry to finance expansion.
Since the end of the last recession, the airlines’ balance sheets have been considerably strengthened, even allowing for the replacement of large numbers of noisier aircraft that did not meet current Chapter 3 standards. ICAO figures show the debt/equity ratio for the world’s scheduled airlines declining from a high of 2.9:1 at the end of 1993 to 1.3:1 at the end of 1999.1
However, clouds appeared on the horizon in 1999, with the price of jet fuel jumping from 40 cents per US gallon a barrel to 75 cents in January 2000. This led to a drop in operating profits, although net profits were maintained largely due to the sale of aircraft and non-core investments such as holdings in IT and communications companies. The dollar price of fuel in 2001 was still well below its high in 1981. At that time fuel expenses rose to just under 30% of total airline operating expenses. In 2000, they were still only 12% of the total, even after recent sharp increases. This has been helped by substantial advances in fuel efficiency. For example, British Airways has reduced its average consumption in terms of grams per revenue tonne-km from around 440 in 1990/91 to 345 in 1999/2000 (or by an average of 2.6% a year), and is on track to meet its target of 306 gms in 2010.2
As stated above, the fuel price started increasing alarmingly in early 1999; a further advance occurred at the end of Summer 2000 to a high of 107 cents, before the price fell back to around 75 cents by the end of 2000.3
Some economists link any sudden and substantial rise in fuel prices to an economic recession about 18 months later. This appeared to be happening in 2001, as the downturn in the US economy began to have a serious effect on Asian exports, especially for countries such as Taiwan and Malaysia. The impact of declining GDP for the major world economies such as the US, EU and Japan has in the past led to a downturn in traffic (Figure 1.1). The first ever decline (as opposed to large reduction in growth rate) in world air traffic growth in 1991 was due to the combined effects of the Gulf War and the world economic recession.
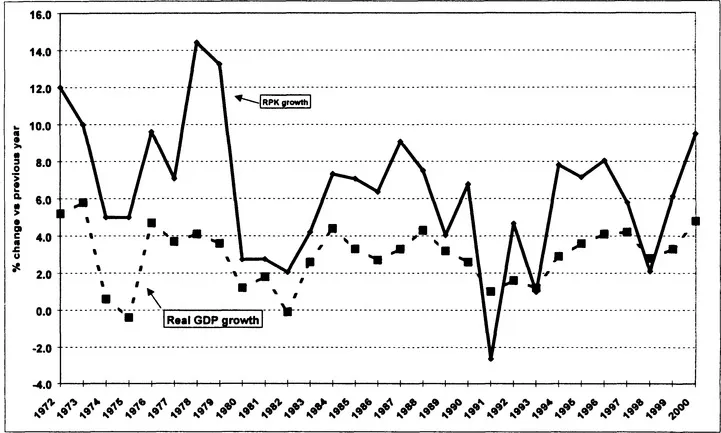
Figure 1.1 ICAO scheduled airline traffic growth vs. world GDP growth
Figure 1.2 shows the cyclical nature of past financial results for the world’s scheduled airlines. As mentioned above, the impact of rising fuel prices on costs resulted in a deterioration in operating results for 1999 and 2000. Other cost items such as flight crew salaries also rose sharply for some airlines in 2000/01, but this has been cushioned to some extent by lower distribution costs. The Asian financial crisis of 1997/98 can be seen to have had little effect on the fortunes of the world’s airlines.
The difference between the operating and net profit is caused by net interest paid, gains or losses on asset sales, taxes and subsidies. Interest paid is the largest of these items, and this has declined in the second half of the 1990s due to the combined effects of falling interest rates and lower debt outstanding. Profits from asset sales also make a good contribution in some years, generating almost $3 billion in both 1998 and 1999.

Figure 1.2 ICAO scheduled airline financial results
Preliminary estimates for 2001 suggest that most of the US majors and a number of large European carriers are heading for losses. Thus the cyclical pattern looks like recurring, although the length of the upswing has been longer than on previous occasions. The other difference this time is that more airlines are privately owned, and subsidies might be not be expected to be forthcoming. However, the re-nationalisation of Malaysian Airlines (see Chapter 5) and the possibility of the New Zealand government guaranteeing loans to their privatised national airline, Air New Zealand, indicate that air transport may still get special treatment.
Subsidies approved by the European Commission for payment to just five European airlines (Olympic Airways, TAP Air Portugal, Iberia, Air France and Aer Lingus) between 1992 and 1997 totalled US$8.94 billion, or almost 17% of the sum of the airlines’ three previous years’ revenues.4 On the basis that they were paid in equal instalments over the five years, 1992 to 1997, this would have amounted to $1.8 billion a year. Two of these airlines, TAP and Olympic, are still in some trouble, and another, Sabena, is being supported by both the Belgium government and the Swissair Group.
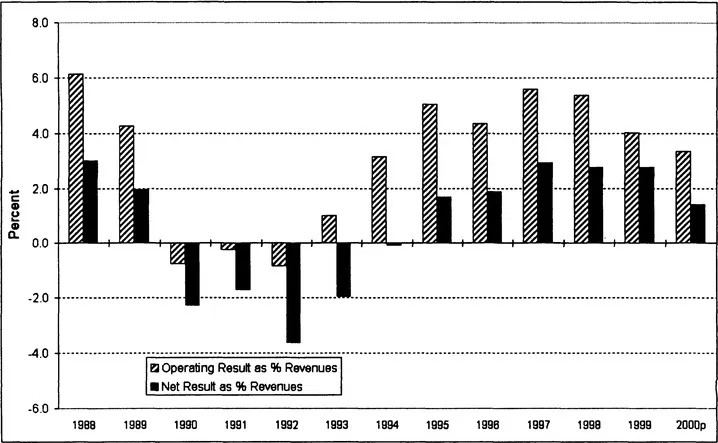
Figure 1.3 ICAO scheduled airline financial results as % revenues
ICAO do stress that published operating and net results are susceptible to ‘substantial uncertainties’.5 This is particularly the case with the net results, which are the small differences between estimates of large figures (revenues and expenses). Just under 15% of revenues and expenses are estimated for non-reporting airlines.
The increased use of operating leases over the second part of the 1980s has tended to switch the emphasis of costs from non-operating interest on loans or finance leases to rentals, included in operating expenses. Thus, net interest paid would have increased further, had this trend not occurred.
The operating margin for the world’s scheduled airlines only exceeded 5% twice during the 1980s. This improved marginally to just three years in the 1990s (Figure 1.3). Smaller airlines would require higher margins to survive than larger, and two relatively small ‘low cost’ airlines, Ryanair and Westjet, were amongst the top five world airlines in 2000 with ratios of 23% and 16% respectively. Southwest, now a US major, achieved 18% in the same year, and two Asian airlines, Singapore and Cathay, have traditionally been among the leaders of the larger world airlines.6

Figure 1.4 Operating result as % revenues by region of airline
Source: The World of Civil Aviation, ICAO
Figure 1.4 shows the financial margins for the world’s airlines according to the region in which they are based. It shows that the North American airlines were hardest hit by the Gulf War recession, with a number going out of business, and the remainder surviving by obtaining new equity and debt finance. As mentioned above, some of the European airlines were more fortunate in obtaining government support. Asian based airlines were the least affected by the Gulf War recession, and experienced much better margins than airlines of other regions in the early 1990s. European airlines as a whole broke even, but the US airlines were largely responsible for the large world airline operating losses of the early 1990s. The US airline problems in fact began before the Gulf War and early 1990s recession. Their unit costs and capacity both rose strongly in 1989 and 1990, resulting in a large loss in 1990.
The European results varied significantly, with some of the European flag carriers, such as Air France, Iberia, Alitalia and Sabena, making large operating losses, offset by the few profitable European carriers such as British Airways.
One of the key drivers in the subsequent airline recovery was load factors, although yield and cost trends were also clearly important. Figure 1.5 shows that the US carriers’ passenger load factor was both the lowest and recovered the most. It is noticeable that load factors have converged for the airlines of the three major regions, reaching an effective ceiling given the nature of the service offered and the variation of demand by day, week and season.

Figure 1.5 Passenger load factor trends by major world region
Source: Boeing, AEA, AAPA and Air Transport World data
The recovery of Asian economies, and the Asian airlines, from the region’s 1997 financial crisis has been remarkable. The 18 members of the Association of Asia Pacific Airlines (AAPA) reported collective after-tax profits of US$1.88 billion for 1999/2000, a four-fold increase from the previous year. This contrasted with their combined loss of US$1.21 billion in 1997/98, only two years previously.7 This recovery stemmed principally from the bounce back of the economies of the region, but also from the success of implementing cost controls (apart from fuel costs which rose by 20.2%) and a significant increase in staff productivity. Only two of the 16 AAPA member airlines submitting data did not make an operating profit in 1999/2000, Malaysia Airlines and Royal Brunei Airlines.
In the USA, a Commission reported to the President and Congress in August 1993 on the state of the airline industry.8 In addition to the accumulation of large amounts of debt, the Commission attributed some of the airlines’ problems to the weak economy and government policies. The latter had imposed large tax increases on airlines at the beginning of the 1990s, as well as the costs of modernisation of airports and the air traffic control system. They recommended that a presidentially appointed airline advisory committee be created, and that the Department of Transportation be more closely involved with monitoring and regulating the financial state of the industry. They also suggested various changes to the Chapter 11 bankruptcy provisions, which had perhaps conferred unfair cost advantages on a number of airlines which had sought this protection from their creditors.
The Europeans reacted in a similar way, albeit a little later, to the early 1990s problems of the industry. The European Commission appointed a committee in 1993, which included five airline representatives (out of 12) as opposed to the US commission’s two (out of 15). In their early 1994 report, the European ‘Committee of Wise Men’ made the following financial recommendations:9
- The EU should work towards easing the ownership and control restrictions in bilateral agreements.
- The EU should try to maintain and improve the access of European airlines to credit insurance.
- The European Commission should try to expand the number of financing options available to airline management.
By the time that these two reports had been dig...
Table of contents
- Cover
- Half Title
- Title Page
- Copyright Page
- Contents
- Tables and Figures
- Preface
- 1 Industry Financial Performance
- 2 Airline Financial Statements
- 3 Airline Financial Ratios
- 4 Airline Valuation
- 5 Airline Privatisation
- 6 Airline Financial Planning and Appraisal
- 7 Foreign Currency and Fuel Price Exposure
- 8 Sources of Airline Finance
- 9 Aircraft Leasing
- 10 Aircraft Securitisation
- 11 Industry Financial Prospects
- Bibliography
- Glossary of Terms
- Index
Frequently asked questions
Yes, you can cancel anytime from the Subscription tab in your account settings on the Perlego website. Your subscription will stay active until the end of your current billing period. Learn how to cancel your subscription
No, books cannot be downloaded as external files, such as PDFs, for use outside of Perlego. However, you can download books within the Perlego app for offline reading on mobile or tablet. Learn how to download books offline
Perlego offers two plans: Essential and Complete
- Essential is ideal for learners and professionals who enjoy exploring a wide range of subjects. Access the Essential Library with 800,000+ trusted titles and best-sellers across business, personal growth, and the humanities. Includes unlimited reading time and Standard Read Aloud voice.
- Complete: Perfect for advanced learners and researchers needing full, unrestricted access. Unlock 1.4M+ books across hundreds of subjects, including academic and specialized titles. The Complete Plan also includes advanced features like Premium Read Aloud and Research Assistant.
We are an online textbook subscription service, where you can get access to an entire online library for less than the price of a single book per month. With over 1 million books across 990+ topics, we’ve got you covered! Learn about our mission
Look out for the read-aloud symbol on your next book to see if you can listen to it. The read-aloud tool reads text aloud for you, highlighting the text as it is being read. You can pause it, speed it up and slow it down. Learn more about Read Aloud
Yes! You can use the Perlego app on both iOS and Android devices to read anytime, anywhere — even offline. Perfect for commutes or when you’re on the go.
Please note we cannot support devices running on iOS 13 and Android 7 or earlier. Learn more about using the app
Please note we cannot support devices running on iOS 13 and Android 7 or earlier. Learn more about using the app
Yes, you can access Airline Finance by Peter S Morrell in PDF and/or ePUB format, as well as other popular books in Social Sciences & Sociology. We have over one million books available in our catalogue for you to explore.