In an era of federal deficits and struggling municipalities, states have emerged as the most significant governmental actors. But state governments face the major challenge of fiscal planning in the midst of economic change. Roy Bahl and William Duncombe tackle this challenge head-on. Using New York as a case study, they identify looming dangers for state revenue and expenditure planning.Bahl and Duncombe begin with the premise that one cannot separate an evaluation of fiscal performance from an evaluation of economic performance. Accordingly, they describe and analyze the patterns of population, employment, and personal income growth. Following this is a study of state and local government finances in New York since 1970 and a recounting of the fiscal adjustments that were taken in the face of slower and then faster growth in the economy.The authors conclude that based on current conditions, the state and its local governments are in for fiscal belt-tightening. They note that the state should take a comprehensive view in planning the development and retrenchment of its government sector. The book is thought-provoking, exhaustively researched, and sensibly written. Its lessons are applicable everywhere and should be read by all those seeking a route through the tangled thicket of government policy for economic growth.
- 335 pages
- English
- ePUB (mobile friendly)
- Available on iOS & Android
eBook - ePub
Economic Growth and Fiscal Planning in New York
About this book
Trusted by 375,005 students
Access to over 1.5 million titles for a fair monthly price.
Study more efficiently using our study tools.
Information
Subtopic
Development EconomicsIndex
EconomicsPART I
New York’s Economy in the 1980s
1
Population
Population trends are one of the most publicized (and probably least understood) indicators of state economic health. The rapid population declines of the 1970s in New York State brought out-migration to the forefront of the economic policy agenda. During the 1970s, the state lost nearly 700,000 people (almost 4 percent of the 1970 population), with most of this loss occurring in New York City. There has been a pronounced reversal of this population decline, with the state gaining almost 400,000 people since 1980. Most of this growth has occurred in New York City.
These aggregate statistics tell only part of the story. There have been important changes in the demographic and migration patterns that underlie these trends that have significant implications for New York public policy. This review attempts a look beneath the general trends.1
General Trends
There is no question that the population declines of the 1970s were reversed in the 1980s. Total state population grew by 2.2 percent from 1980 to 1989 (0.2 percent per year). This compares to a decline of 3.7 percent during the 1970s (Figure 1; Table 1). However, this recovery must be kept in perspective. Population growth was still well below that in other northeastern states or in the nation as a whole. If New York State had grown at the national rate, it would have added close to 1.3 million more people since 1980. This below-average growth is forecast to continue through this century, although the gap is expected to narrow.
FIGURE 1
Population Trends (1970–1989) New York, Other Northeast Region, and Total United States
Population Trends (1970–1989) New York, Other Northeast Region, and Total United States
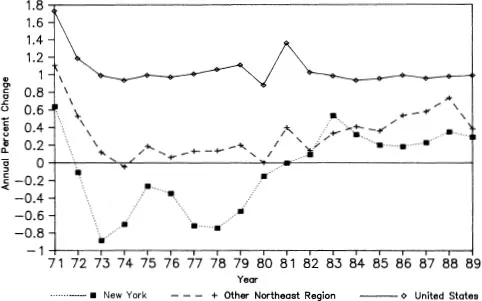
Source: U.S. Bureau of the Census
Even within the Northeast region, population growth in New York State has continued to lag behind (Table 2). Only Pennsylvania and Massachusetts have experienced similar slow growth rates. If New York State had grown at the average rate for other Northeast states, it would have added 300,000 residents since 1980. The relatively slow population growth in New York and the other northeastern states implies that they have declined as a share of the total U.S. population. New York’s share has fallen from 9.0 percent in 1970 to 7.2 percent in 1989. By the end of the century, New York is projected to account for less than 7 percent of the U.S. population and will be surpassed by Texas as the second largest state. The effect of New York’s declining share of population on its economy and finances is unclear; however, one certain result is the declining political representation in the U.S. Congress of New York and most northeastern states in the 1990s. As will be discussed more fully in chapter 6, this may have a significant influence on the distribution of federal aid and contracts.
TABLE 1
Population Trends and Projections: Resident Population for New York, The Northeast Region, and the United States (In Thousands)
Population Trends and Projections: Resident Population for New York, The Northeast Region, and the United States (In Thousands)
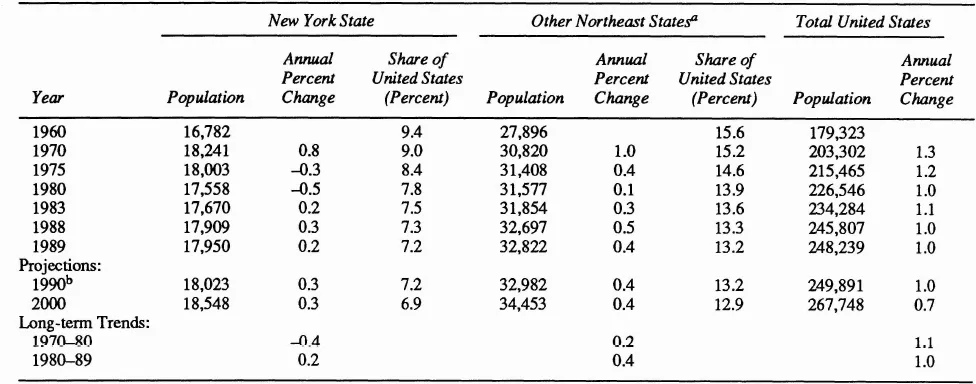
aIncludes the Mideast and New England regions as defined by the Bureau of the Census except for New York.
bPercent change from 1980 to 1990.
Source: U.S. Department of Commerce, Bureau of the Census, Current Population Reports, Nos. 1044 and 1053; U.S. Census of Population: 1960,1970, and 1980, and press release, December 29, 1989 (with 1989 population estimates); and New York State Data Center, Official Population Projections for New York State Counties: 1980–2010, April 1985.
TABLE 2
Population Trends New York Compared to Other Northeast States
Population Trends New York Compared to Other Northeast States
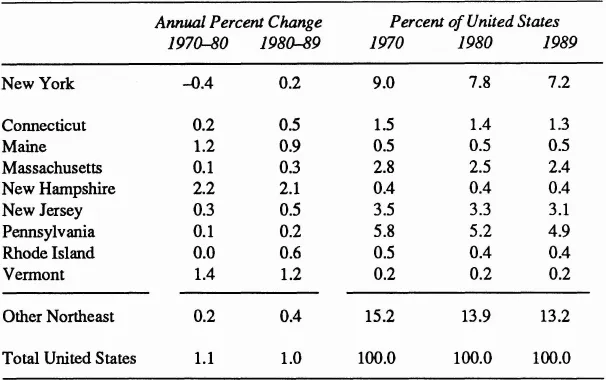
Source: U.S. Department of Commerce, Bureau of the Census, Current Population Reports, No. 998, and press release, December 29, 1989 (with 1989 population estimates).
There has been a major shift in the geographic pattern of population growth rates within the state, as described in Table 3 and Figure 2. The decline in the 1970s was due primarily to a major population loss in New York City—800,000 people in total or an annual rate of 1.1 percent for the decade. This was accompanied by a deconcentration in the New York City area as population grew rapidly in the distant suburbs of Putnam, Rockland, and Suffolk counties and in the mid-Hudson region of Dutchess, Orange, and Ulster counties.2 There were also population declines in many of the central city counties in upstate New York, with populations in Erie, Chemung, and Broome counties all declining by at least 0.4 percent per year.
These patterns changed in the 1980s. New York City had been one of the fastest growing areas of the state (0.5 percent per year).3 Population increased by more than 280,000 in New York City between 1980 and 1988–80 percent of the state population growth during this period. Growth has actually been slower in the New York City suburban counties than in the city. This pattern was clearly not anticipated even by the demographers in the New York State Data Center. New York City has surpassed the level of population projected for the year 2000 in the recent state forecasts.4
TABLE 3
Population Trends and Projections: Resident Population In New York City, New York City Suburbs, and the Rest of the State (In Thousands)
Population Trends and Projections: Resident Population In New York City, New York City Suburbs, and the Rest of the State (In Thousands)
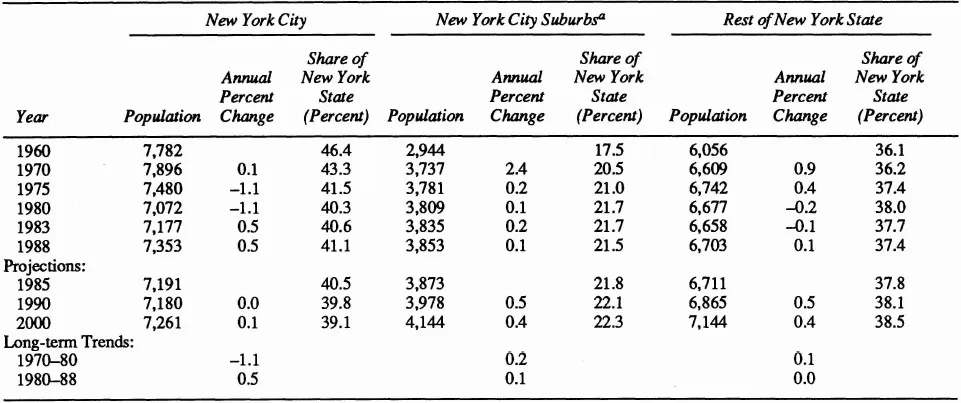
a Includes Nassau, Putnam, Rockland, Suffolk, and Westchester counties.
Source: U.S. Department of Commerce, Bureau of the Census, and New York State Data Center, unpublished population estimates for New York, and Official Population Projections for New York State Counties, 1980–2000, April 1985.
FIGURE 2
Population Trends (1970–1988) New York City, Suburbs, and Other New York State
Population Trends (1970–1988) New York City, Suburbs, and Other New York State
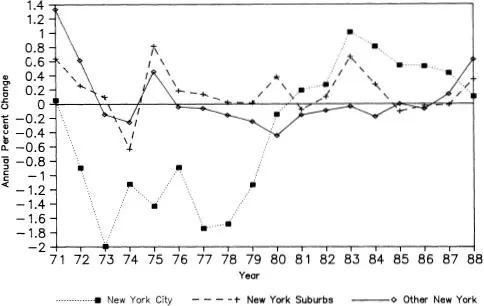
Sources: New York State Data Center; U.S. Bureau of the Census
There has been slight population growth in the rest of the state. The western and central regions of the state generally fared the worst in the 1980s and in some cases grew even less than in the 1970s.5 Particularly hard hit were the traditional manufacturing centers of Buffalo, Elmira, Utica, and Binghamton. The State Data Center has forecast slow growth in these areas in the 1990s.
The most rapid growth occurred in the mid-Hudson region of Dutchess, Orange, and Ulster counties, where population grew at the national rate. This appears to be driven by rapid in-migration from within the state and has been accompanied by rapid employment growth (close to 3 percent per year). This is consistent with the continued deconcentration of population and economic activity in the New York City metropolitan area.
Population growth in urban and rural areas appeared to have returned to their historic patterns in the 1980s. In the 1970s, population declined sharply in central cities (1.1 percent per year) while nonmetropolitan areas and suburban counties experienced population growth (0.7 percent per year). New York State fit the general national patterns of nonmetropolitan area growth and deconcentration within urban areas.6 This was a reversal of the long-term trend for population growth in urban areas to exceed that of rural areas.
The relative decline of metropolitan areas in New York appears to have ended in the 1980s.7 This is consistent with national trends and with growth patterns in New Jersey and Pennsylvania. However, several of the New England states, particularly Connecticut and Massachusetts, continue to experience more rapid growth in nonmetropolitan areas.8 It should be pointed out that the population of New York metropolitan areas without New York City has grown less than 0.1 percent per year since 1980, well below the growth rate for nonmetropolitan areas. The New York State Data Center has projected that the patterns of the 1970s will continue until the end of the century; that is, nonmetropolitan and suburban counties will be the main source of growth in the 1990s.
Changes in Population Composition
The last several decades have also been a time of significant changes in the composition of the New York State population. In the 1970s, the population in the state grew older, more racially diverse, and was increasingly apt to be in “nontraditional” households.9 These trends appear to have continued in the 1980s and may have significant repercussions on the tax base and the demand for government services.
The changing demographic patterns between 1970 and 1980 have been well documented in other sources.10 Unfortunately, there is limited availability of demographic information in noncensus years, but this section will attempt to present some evidence on patterns in the 1980s. Specifically, we examine changes in the age structure and racial composition of New York during the 1980s using several recent census publications.11 Combined with information on national trends in household composition and poverty, it is possible to draw inferences about the changing status of families and children during the 1980s.
Age Structure
The well-documented aging of the American population has occurred in New York State as well. The median age of the population increased from 30.3 years in 1970 to 31.8 in 1980 and 34.0 in 1989.12 This parallels national trends, although New York State has long had an older population. There has been a sharp decline in the percent of the population below twenty-five years of age (Table 4). The percentage of total population in New York below twenty-five years of age fell from 43 percent in 1970 to 35 percent in 1989. The decline in the relative share of children has not been as sharp in New York as it has been in other northeastern states or for the nation as a whole. This appears to be due to less of a decline in New York City, which may be partially explained by the sizable foreign immigration of families in their childbearing years into the city. These trends are expected to continue through the remainder of the century in New York State and in the nation.
Most of the population growth has occurred in the early middle-age years as the baby boom generation has passed from the young adult years, which experienced rapid growth in the 1970s.13 The percentage of New York State population between thirty-five and fifty-four years old increased from 22.5 percent in 1980 to 25.5 percent in 1989. By the turn of the century, this category is expected to account for more than 30 percent of the total population.
There has been strong growth in the number of the elderly in New York State in the 1980s, with most growth occurring in the age bracket of more than seventy-five years. Growth is expected to continue in the 1990s; the percent of population sixty-five years or older is forecast to grow from 12.3 percent in 1980 to 13.7 percent in 2000. However, most of this growth will be in the sixty-five to seventy-four age group—the “young old.” This group is less dependent on outside assistance and more apt to migrate out of state. New York State has consistently had one of the highest out-migration rates for the elderly in the co...
Table of contents
- Cover
- Half Title
- Title Page
- Copyright Page
- Dedication
- Table of Contents
- Tables
- Figures
- Preface
- Introduction
- Part I. New York’s Economy in the 1980s
- Part II. New York’s Fiscal Performance and Health
- Part III. New York’s Finances in the 1990s
- Appendix A Geographic Definitions
- Appendix B Population Data
- Appendix C Employment Data
- Appendix D Personal Income Data
- Appendix E Fiscal Data
- Bibliography
- Index
Frequently asked questions
Yes, you can cancel anytime from the Subscription tab in your account settings on the Perlego website. Your subscription will stay active until the end of your current billing period. Learn how to cancel your subscription
No, books cannot be downloaded as external files, such as PDFs, for use outside of Perlego. However, you can download books within the Perlego app for offline reading on mobile or tablet. Learn how to download books offline
Perlego offers two plans: Essential and Complete
- Essential is ideal for learners and professionals who enjoy exploring a wide range of subjects. Access the Essential Library with 800,000+ trusted titles and best-sellers across business, personal growth, and the humanities. Includes unlimited reading time and Standard Read Aloud voice.
- Complete: Perfect for advanced learners and researchers needing full, unrestricted access. Unlock 1.5M+ books across hundreds of subjects, including academic and specialized titles. The Complete Plan also includes advanced features like Premium Read Aloud and Research Assistant.
We are an online textbook subscription service, where you can get access to an entire online library for less than the price of a single book per month. With over 1.5 million books across 990+ topics, we’ve got you covered! Learn about our mission
Look out for the read-aloud symbol on your next book to see if you can listen to it. The read-aloud tool reads text aloud for you, highlighting the text as it is being read. You can pause it, speed it up and slow it down. Learn more about Read Aloud
Yes! You can use the Perlego app on both iOS and Android devices to read anytime, anywhere — even offline. Perfect for commutes or when you’re on the go.
Please note we cannot support devices running on iOS 13 and Android 7 or earlier. Learn more about using the app
Please note we cannot support devices running on iOS 13 and Android 7 or earlier. Learn more about using the app
Yes, you can access Economic Growth and Fiscal Planning in New York by William Duncombe in PDF and/or ePUB format, as well as other popular books in Economics & Development Economics. We have over 1.5 million books available in our catalogue for you to explore.