Four ways to view GDP
GDP can be viewed in a number of helpful ways, but regardless of the approach, each of them sums to the same total (GDP) number. Mercifully, each of these approaches has a strong element of common sense, which makes all of them easy to understand.
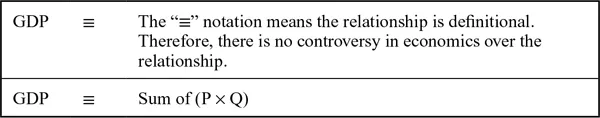
Price-quantity approach to explaining GDP
GDP can be calculated by multiplying the price of every final good and service by the quantity produced per period and then summing these products. If P stands for the price of final G&S and Q stands for the quantity produced each period, then GDP equals the sum of all these prices times quantities (see Figure 1.1).
Figure 1.1 GDP: price-quantity approach.
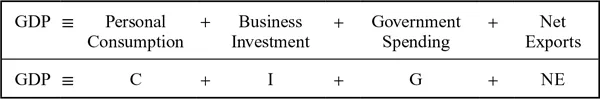
G&S demand approach to explaining GDP
The four major economic sectors that demand a nation’s final G&S are (1) domestic consumers, (2) domestic businesses, (3) domestic governments (national, state, and local), and (4) foreign consumers, businesses, and governments. Therefore, GDP can be viewed as the sum of personal consumption expenditures (C), intended business investment expenditures plus unintended changes in business inventories (I), government expenditures on final products (G),2 and net export (NE) expenditures.3 See Figure 1.2.
Figure 1.2 GDP: Goods & services (G&S) demand approach.
Two important points are worthwhile remembering about I. First, in the context of GDP, businesses purchases of final G&S include products, such as machinery, tools, equipment, and inventories, as well as residential housing4 and business construction. This GDP component does not include the demand for financial investments in stocks, bills, notes, or bonds. Second, increases in business inventories can be intended (voluntary) or unintended (involuntary). Businesses voluntarily increase their inventories when they expect sales to rise. They involuntarily do so when they produce goods that are not sold. In either case, any increase in inventory quantity is counted as part of GDP’s investment (I) component.
Income approach to explaining GDP
Any time a good or service is produced, someone is paid for the effort. Therefore, GDP can also be viewed as the sum of incomes earned from producing final G&S. Economists categorize income-earners into four groups, namely labor, natural resources, real (physical) capital, and entrepreneurs. The return to physical and mental capabilities of labor is called the wage; the return to natural resources is called rent; the return to real capital (i.e., human-made aids to production) is called interest,5 and the return to risk-taking (entrepreneurship) is called profit. See Figure 1.3.
Figure 1.3 GDP: Income approach.
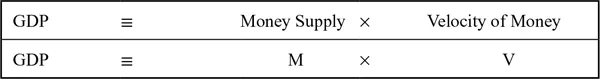
Money supply-and-velocity approach to explaining GDP
In Chapter 9: Money, banking, and central banks, we will discuss how nations measure their money supplies. For now, think of money (M) as all the coins and paper currency that individuals in a nation hold (outside banks) plus their checking accounts. In 2016, the U.S. money supply equaled approximately $3 trillion. At the same time, U.S. GDP totaled about $18 trillion. How can a nation’s GDP be so much larger than the money available to purchase it? The answer is money is spent more than once a year. In short, it has a velocity (V). Therefore, if a nation’s GDP equaled $18 trillion and money supply equaled only $3 trillion, then each dollar must have been spent (for newly produced G&S) six times during the course of the year. As a result, GDP can be viewed as the product of M times V. See Figure 1.4.
Figure 1.4 GDP: Money supply-velocity (M × V) approach.
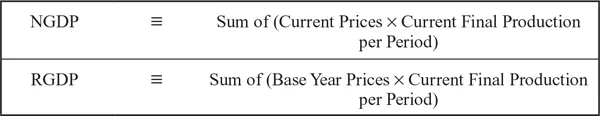
Nominal versus real GDP
The price-quantity approach to explaining GDP, which was described in the last section, is helpful for clarifying the difference between real and nominal GDP. Nominal GDP (NGDP) equals the sum of prices times quantities for all final G&S produced per period. Therefore, it can increase if production (i.e., Q) and/or prices (i.e., P) rise. Increases in prices give the illusion of growth and prosperity but without material substance. To eliminate this illusion, nations calculate real GDP (RGDP), which removes the effects of higher prices by multiplying the quantities produced each period by the prices in a base year (see Figure 1.5). By using only base-year prices, RGDP can rise only if output (i.e., Q) per period increases. In virtually all economic discussions, RGDP is more important than NGDP.
Figure 1.5 NGDP versus RGDP.
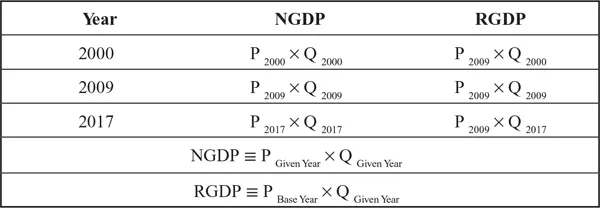
To maintain a contemporary perspective, national statistical offices periodically change the base year used to calculate RGDP. The new one selected is determined by its stability relative to nearby years. Figure 1.6 shows the difference between RGDP and NGDP for 2000, 2009, and 2017, assuming 2009 is the base year.
Figure 1.6 RGDP versus NGDP (2009 = base year).
Calculating a nation’s economic growth rate
Economic growth is measured as a percentage change in RGDP. Just as a movement from $100 to $110 is a 10 percent change (i.e., $10/$100 = 0.10 × 100 percent = 10 percent) and a movement from $110 to $120 is a 9.1 percent change (i.e., $10/$110 = .091 × 100 percent = 9.1 percent), the percentage change in RGDP is calculated by dividing the change in RGDP by the original RGDP and then multiplying the result by 100 percent. Figure 1.7 shows the economic growth calculation between Year 1 and Year 2.
Figure 1.7 Calculating real economic growth.
Business cycles
Business cycles are “recurring, irregular, and unsystematic movements in real economic activity around a long-term trend.”6 Recessions are significant contractions in economic activity, which are spread broadly across an economy and last for more than a few months. Expansions (also called recoveries) are just the opposite.
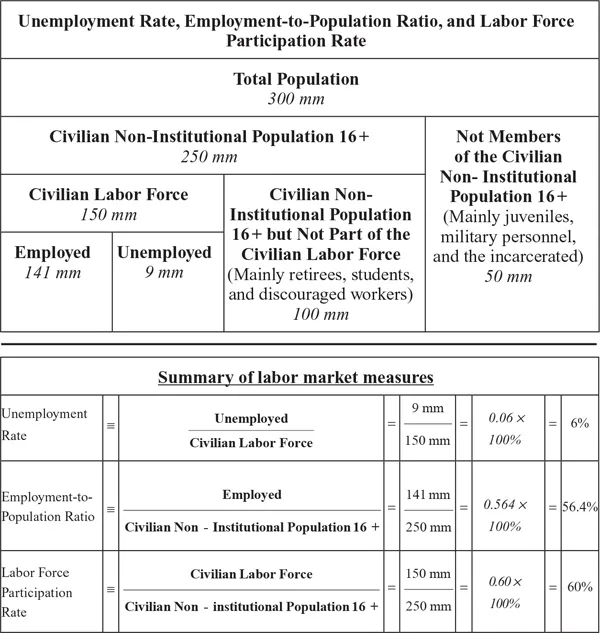
In the news media, a nation is often said to be in a “recession” when its RGDP falls for two consecutive quarters, but, officially, recessions are not measured or dated this way. Rather, a spectrum of macroeconomic variables is used to gauge a nation’s economic health. For example, the National Bureau of Economic Research, a private organization, measures and dates U.S. expansions and contractions (i.e., business cycles) by using the employment-to-population ratio (also called the employment rate), real personal income, sales volumes for the manufacturing and trade sectors, and industrial production. These variables were chosen above others because, historically, they were shown to be the most timely, significant, reliable, consistent, and accurate reflections of U.S. economic activity. RGDP is excluded from this list because it is reported relatively infrequently (quarterly, instead of monthly) and is often subject to considerable revisions.