- 160 pages
- English
- ePUB (mobile friendly)
- Available on iOS & Android
eBook - ePub
Continual Improvement in Government Tools and Methods
About this book
Key to the success of quality implementation is the understandingteam members have of the process and the tools to be used. Continual Improvement in Government: Tools and Methods was designed to provide users with a complete description and practical examples of these tools and viable techniques that will benefit teams. This book examines the four most popular tools: flowcharting; cause and effect diagrams; Pareto charts; and histograms-and shows how to apply them in the public service sector.To improve processes requires effective decision-making and effective decision-making begins with accurate data. Koehler and Pankowski dispel the myths and fears of data collection and analysis. In a step-by-step approach, they lead you through the very heart of Quality Management...DATA. Continual Improvement in Government: Tools and Methods provides an understandable format that explains the importance of data, the differences in the quality of data, why it is collected, and how it is used.
Trusted by 375,005 students
Access to over 1.5 million titles for a fair monthly price.
Study more efficiently using our study tools.
1 Introduction
Government organizations are experiencing dramatic change. Many are moving from traditional methods of managing to a quality perspective, where the focus is on the customer, continual improvement of processes, the team approach, and processes driven by accurate and meaningful data. In the early 1990s, we accepted the challenge of implementing Total Quality Management in the Department of Revenue and the Department of Labor and Employment Security in the State of Florida. A complete description of how we implemented TQM in government can be found in our book Total Quality Government: Designing, Developing and Implementing Total Quality Management by St. Lucie Press.
Our purpose in writing this book is to describe in detail how quality organizations in government collect and use data to continually improve government processes. Our aim is to provide a book that clearly identifies quality tools and methods, and the steps necessary to employ them in government organizations. We have tested every tool and method in this book in a government setting and have found their application to be extremely beneficial in improving processes.
How organizational members use these tools will differ significantly. Each tool and method is extremely valuable. However, our approach to continual improvement in government was largely based upon teams. Therefore, we take the position that quality tools and methods are interrelated and therefore, all team members should be competent in using all quality tools and methods. The choice of tools and methods is governed in large measure by teams composed of organizational members, which we refer to as “associates.” Their mission is to continually improve the processes to which they are assigned.
When we began implementing process improvement teams in government, we realized that many team members had limited analytical skills, little understanding of mathematics and even less knowledge of statistics. It was not uncommon to have the majority of members on a team whose education was complete at the high school level. Dedicated as they were to finding solutions to their problems, they truly feared any mention of numbers, data collection or mathematical charts. Even those with Bachelo’s or Master*s degrees were often not comfortable working with statistics. Our intent in this book is to reduce these fears and provide a clear, simple approach to collecting and analyzing data for improving government processes.
Many government organizations are now finding that people working together in teams, as opposed to just working on a single task, have been very successful in improving the way work gets done. We have observed dramatic results when process improvement teams are instituted in government organizations. Teams are most successful when they focus on the customers of their processes, flow chart their processes and allow data collected with the assistance of quality tools to drive their decisions. Not all teams are successful, and from our experience the number one reason for lack of team success is the team’s inability to use tools and methods in collecting and analyzing data and in making decisions.
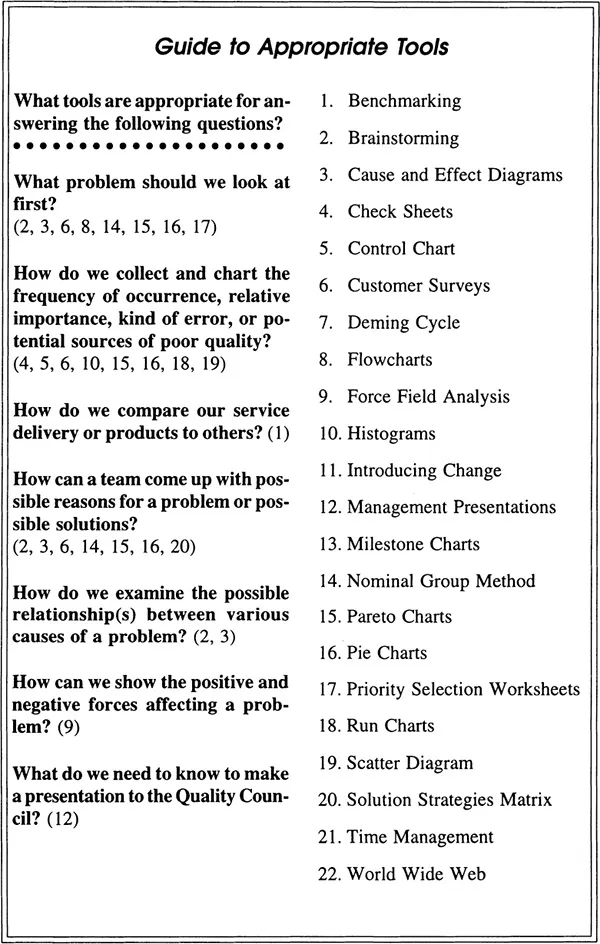
Continual process improvement requires data collection and analysis, and successful teams understand when and how to use quality tools when the occasion demands their use. Just as an electrician or plumber may use some tools on a daily basis and others rarely, teams should also use appropriate tools that help them to improve a process. We found that when introducing tools and methods to a new continual improvement team, the following principles should be stressed:
- Work in government organizations can best be understood and improved if activities are composed of processes.
- Government processes involve activities that can be improved.
- The goal of each process is to meet or exceed customer expectations.
- Continual improvement produces lasting results.
- Continual improvement requires understanding of a process.
- People closest to the process are in the best position to improve it.
- Measurement of each process is essential.
- Graphic problem solving works best with processes that are charted.
- Decisions to improve the process are data-based.
- Understanding and applying continual improvement tools and methods facilitate problem solving.
There are shelves of textbooks devoted to the subject of data collection, and the reader is encouraged to refer to them as necessary. The intent of this introduction to tools and methods is not to prepare one to present dissertation findings before a university doctoral committee, but rather to provide an overview and introduction to tools that will facilitate process improvements in the workplace. What may seem elementary to a few experienced readers will be very beneficial to others who may not have prior experience with formal instruction in tools and methods of TQM. With this introduction, the student who wishes more detail on a particular tool or method can go to the library knowing what to look for and where to find it.
At the heart of Total Quality Management is data. Data drives decisions. Organization members should not make decisions based upon hunches, collective wisdom or what the boss likes. Unfortunately, in many organizations and particularly in government, managers do not make decisions based upon data. They often lack faith in the data they have or do not have quality data given to them.
What is Quality Data?
Quality data is verifiable, accurate and meaningful. It is also timely, valid and reliable.
How do we Collect Quality Data?
Quality data is collected through surveys, process indicators, documented observations, research and the use of TQM tools.
How do we Use Quality Data?
Although data collection and analysis can have multiple applications, including reports to funding sources (budgets, etc.), quality data is used in TQM to improve processes.
- To improve processes requires effective decision-making...
- Effective decision-making begins with accurate data...
Therefore we use quality data to
- identify problems in the process,
- measure process improvements,
- establish base-line data,
- provide feedback to associates working on the process,
- prevent problems,
- set priorities, and
- compare processes.
How do we Display Data?
The purpose of displaying data is to share results with all associates working on the process. Therefore, data is not guarded and kept secret by top management, but is available to everyone. Individuals working on the process should have easy access to the data and have associates available to answer any questions they might have. The data should be displayed on graphs and in flowcharts posted on bulletin boards with telephone numbers for answers to questions.
The collection, analysis, display and use of quality data is the backbone of Total Quality Management. The days of computer printouts filled with statistics stored in files or stacked on shelves in the computer system libraries are over. As teams begin using quality data, they will demand that the data not only be readily available, but be meaningful in terms of the processes under study.
One Final Word About Data
On occasion, team members wonder what data should be collected and analyzed. They might ask why they should even gather more data if sufficient data is already available from their data center. The answer is relatively simple:
- What is important to the customers? Look at your flowcharts. Where are the problems? Where are your customers complaining?
- Is there already data collected at these points?
- If “yes, ” is the data trustworthy? Is the data timely?
- If “yes, ” use it. If not, collect new data based upon what is important to the customers.
What if Our Team Fails to Achieve Process Improvement?
Most process improvement initiatives do some good. If by chance the wrong tool, method or data is used, the process will still probably improve. Total Quality Management has been used in hospitals throughout the world, and there is not one documented case where a patient died because of a tean’s process improvement. If the analysis does not involve “life and death” decisions, whatever improvements occur will far outweigh any potential risk damage to the process. Remember that Total Quality Management is a series of unending, small improvements made by teams of people working to enhance customer satisfaction. The tools and methods on the following pages are designed to achieve this goal. Use them as needed. No team will probably use all, or even half, of the ones covered. However, many will remain “in the bottom of your tool box” waiting for the right application.
What if Our Team Needs Help?
Call for help. Later, we will discuss “process improvement guides” that were used by our agency. You may wish to consider calling in a statistician, if necessary, to help with the more complicated tools. Contact your local community college. There are lots of people interested in quality improvements and who can offer help.
There are actually twenty traditional tools and methods for continual improvement contained in this workbook. Two additional entries, “Time Management” and “World Wide Web” have been added because of their value to teams. In addition we have included “Blue Chips, ” our way of saying that these extras are a bonus worth reading when you have time.
Often, the hardest part of beginning anything new is just that—beginning. Once you and your team are underway, the going will get a bit easier. So, to quote a well-known shoemaker—just do it!
2 Benchmarking
We have presented the tools and methods of Total Quality Management in alphabetical order so they will be easy to locate. Thus “benchmarking” will come early (first), and towards the back will be tools like “solution strategies matrix” and “time management.” On the other hand, it has been our experience that benchmarking is not the most often used of the tools and methods. This is disappointing since there is real merit in this tool.
When someone mentions “benchmarking, ” what is the first image that comes to mind? A bench? Perhaps a mark on a bench? Maybe carpenters place marks on their work benches to serve as quality guides as they cut boards for tables? We’re getting close to the definition.
What is it?
Benchmarking is a way of comparing your processes to those of a recognized leader, in order to identify gaps.
Why Should it be Used?
If you know how you measure u...
Table of contents
- Cover Page
- Title Page
- Copyright Page
- Contents
- ABOUT THE AUTHORS
- 1 INTRODUCTION
- 2 BENCHMARKING
- 3 BRAINSTORMING
- 4 CAUSE AND EFFECT DIAGRAMS
- 5 CHECK SHEETS
- 6 CONTROL CHARTS
- 7 CUSTOMER SURVEYS
- 8 DEMING CYCLE
- 9 FLOWCHARTS
- 10 FORCE FIELD ANALYSIS
- 11 HISTOGRAMS
- 12 INTRODUCING CHANGE
- 13 MAKING PRESENTATIONS
- 14 MILESTONE CHARTS
- 15 NOMINAL GROUP TECHNIQUE
- 16 PARETO CHARTS
- 17 PIE CHARTS
- 18 PRIORITY SELECTION WORKSHEETS
- 19 RUN CHARTS
- 20 SCATTER DIAGRAMS
- 21 SOLUTION STRATEGIES MATRIX
- 22 TIME MANAGEMENT
- 23 WORLD WIDE WEB
- SUGGESTED READINGS
- INDEX
Frequently asked questions
Yes, you can cancel anytime from the Subscription tab in your account settings on the Perlego website. Your subscription will stay active until the end of your current billing period. Learn how to cancel your subscription
No, books cannot be downloaded as external files, such as PDFs, for use outside of Perlego. However, you can download books within the Perlego app for offline reading on mobile or tablet. Learn how to download books offline
Perlego offers two plans: Essential and Complete
- Essential is ideal for learners and professionals who enjoy exploring a wide range of subjects. Access the Essential Library with 800,000+ trusted titles and best-sellers across business, personal growth, and the humanities. Includes unlimited reading time and Standard Read Aloud voice.
- Complete: Perfect for advanced learners and researchers needing full, unrestricted access. Unlock 1.5M+ books across hundreds of subjects, including academic and specialized titles. The Complete Plan also includes advanced features like Premium Read Aloud and Research Assistant.
We are an online textbook subscription service, where you can get access to an entire online library for less than the price of a single book per month. With over 1.5 million books across 990+ topics, we’ve got you covered! Learn about our mission
Look out for the read-aloud symbol on your next book to see if you can listen to it. The read-aloud tool reads text aloud for you, highlighting the text as it is being read. You can pause it, speed it up and slow it down. Learn more about Read Aloud
Yes! You can use the Perlego app on both iOS and Android devices to read anytime, anywhere — even offline. Perfect for commutes or when you’re on the go.
Please note we cannot support devices running on iOS 13 and Android 7 or earlier. Learn more about using the app
Please note we cannot support devices running on iOS 13 and Android 7 or earlier. Learn more about using the app
Yes, you can access Continual Improvement in Government Tools and Methods by Jerry W. Koehler in PDF and/or ePUB format, as well as other popular books in Business & Government & Business. We have over 1.5 million books available in our catalogue for you to explore.