Originally published in 1982. This book describes a comprehensive and integrated model of the UK energy sector which focuses on decision-making and optimisation rather than on forecasting or simulation. It incorporates the production and investment policy of all the major fuels over a fifty-year horizon and analyses strategy under a variety of different assumptions about costs, demands, technology and future decisions. The chapters cover a wide spectrum of energy problems and policy, including scenarios of rising oil and gas prices, and there are striking calculations of the costs of a non-nuclear plus conservation strategy. Interesting reading for those concerned with energy policy.
eBook - ePub
Energy Strategies for the UK
- 254 pages
- English
- ePUB (mobile friendly)
- Available on iOS & Android
eBook - ePub
Energy Strategies for the UK
About this book
Trusted by 375,005 students
Access to over 1.5 million titles for a fair monthly price.
Study more efficiently using our study tools.
Information
1
UK Energy Sector: Past, Present and Future
1.1 Introduction
It is widely believed that Britain has an ‘energy problem’. Of course energy has become very expensive and is likely to become even more expensive in the future. But the real problem is what to do about it. For there is no shortage of proposed energy strategies, and the government is constantly under pressure, from all sides, to adopt one strategy rather than another.
The decision about strategy is not an easy one. The energy sector accounts for about one-tenth of the country’s capital stock. Billions of pounds and hundreds of thousands of jobs are at stake. Considerations of safety, the environment, technological leadership and national security are all involved. Decisions made now will affect our children and grandchildren.
In designing an energy strategy, it would seem useful to have available some mechanism for evaluating the consequences of the various alternatives under consideration, calculating the ‘trade-off’ between the achievement of different goals, and identifying the particular strategies most likely to promote the national interest.
The Birmingham Energy Model is just such a mechanism. It is a large-scale linear programming model designed to calculate and compare optimal strategies for the UK energy sector over the next fifty years under a variety of different assumptions about costs, demands, technology, policy objectives and constraints. The purpose of this book is to explain how the Birmingham Energy Model is constructed and used, and to evaluate some current proposals for UK energy strategies in the light of the model’s results.
This first chapter begins by setting the scene. It describes the changing pattern of energy consumption in the past, the present levels of resource availability, likely future developments in technology, the policy decisions to be taken, the kinds of forecasts that need to be made, the economic, social and political considerations likely to affect policy, and the various proposals put forward by the main protagonists. It should be emphasised that this review is at a very elementary level designed for those readers who are not familiar with the energy problem and techniques of energy modelling. An excellent and more comprehensive analysis of these topics is provided by Eden et al. (1981).
The last two sections of the chapter describe the scope of the Birmingham Energy Model and provide a chapter-by-chapter outline of the book.
1.2 Primary and Secondary Energy
In discussing energy, it is conventional to draw a distinction between primary and secondary energy or fuels. Primary energy refers to the form in which energy is recovered directly from nature. For Britain, the main sources of primary energy are coal, oil, natural gas and uranium. By convention, electricity generated by nuclear power plants, which use uranium as their fuel, is referred to as a primary fuel. Other sources of primary energy are more important in other countries and yet other sources may become more important in the future. They include water flowing over a dam (generating hydroelectricity), wind, waves and the sun.
Some primary fuels, notably coal and natural gas, may be used directly in final consumption. For the most part, however, primary energy is converted into secondary energy, which refers to the form in which energy is used. The main secondary fuels are electricity (produced from coal, oil or natural gas) and oil products (including petrol, kerosene, fuel oil and gas oil). Oil and gas may be produced synthetically from coal, in which case coal is the primary fuel with oil and gas the secondary fuels.
There are of course conversion losses in converting primary energy to secondary energy, and conversion losses in transporting energy from its place of production to the final consumer. Thus (quite apart from imports and exports of energy) the total final consumption of energy (measured in some common unit) is necessarily less than the total consumption of primary energy.
1.3 Changes in Production and Consumption
Since the Second World War, there have been dramatic changes in primary energy production and consumption patterns (Figure 1.1). Over the two centuries to 1955, annual coal consumption in Britain (including consumption in energy industries) increased steadily from less than 10m. tonnes to over 210m. tonnes. For almost all this period, consumption of other fuels was negligible. In contrast, over the next two decades coal consumption fell by half and petroleum (oil) consumption increased fivefold (from 30m. to over 150m. tonnes coal equivalent), thereby replacing coal as the major source of UK energy. By 1975, natural gas supplied half as much energy as coal, and nuclear energy had begun to make a substantial contribution.
The main difference between the production and consumption of primary energy was the export of coal, which increased steadily to a peak of 100m. tonnes in 1910, then continued to decline to a negligible level by 1940.
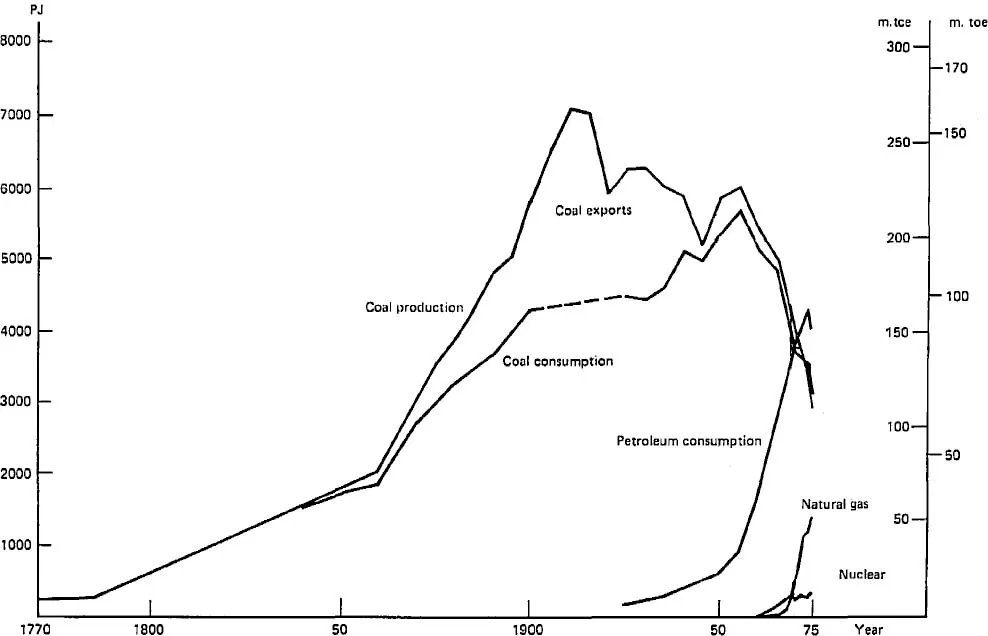
Figure 1.1 Primary fuel consumption and coal production since 1770
The pattern of primary energy consumption between 1948 and 1979 is shown cumulatively in Figure 1.2. (The graph is designed to be comparable to projections made from model solutions to be discussed in future chapters.) It shows the dominance of coal at the outset (71 per cent of total primary energy consumption), a decline in its relative importance as other fuels grew more rapidly up to the middle 1950s and a steady fall in the total amount of coal consumed thereafter. By the early 1970s oil had captured the largest share of primary energy consumption.
An important determinant of this change in the consumption pattern was the movement in relative prices. During the 1950s and 1960s the price of coal rose at about the same rate as the domestic price index, whereas the price of oil imports fell in absolute terms. Roughly speaking, the price of oil imports fell from about twice the price of coal in 1950 to three-quarters of it in 1970. However, because of the substantial fuel tax imposed in 1961, the movement of relative market prices has been less marked.
At the beginning of the 1960s, over 90 per cent of Britain’s gas manufacturing capacity was based on coal (Figure 1.3). By the end of the 1960s over 80 per cent was based on oil. Within another decade, both coal and oil were completely displaced as sources of gas supply, and in 1975 natural gas provided almost 14,000m. therms of primary energy in 1979 (1468 PJ or 5.6 mtce). The consumption of natural gas continued to grow at a rapid rate until 1979, reflecting its price advantage over electricity and oil.
Coal has remained the dominant fuel in electricity production throughout the period (Figure 1.4). However, its share in total electricity production has fallen owing partly to the increase in electricity generated at oil-fired power stations in the late 1960s and early 1970s, and partly to the expansion of nuclear electricity production (a sixteenfold increase between 1960 and 1979). In 1979, the electricity industry was the major consumer of coal taking almost 69 per cent (129m. tonnes) of the total inland consumption.
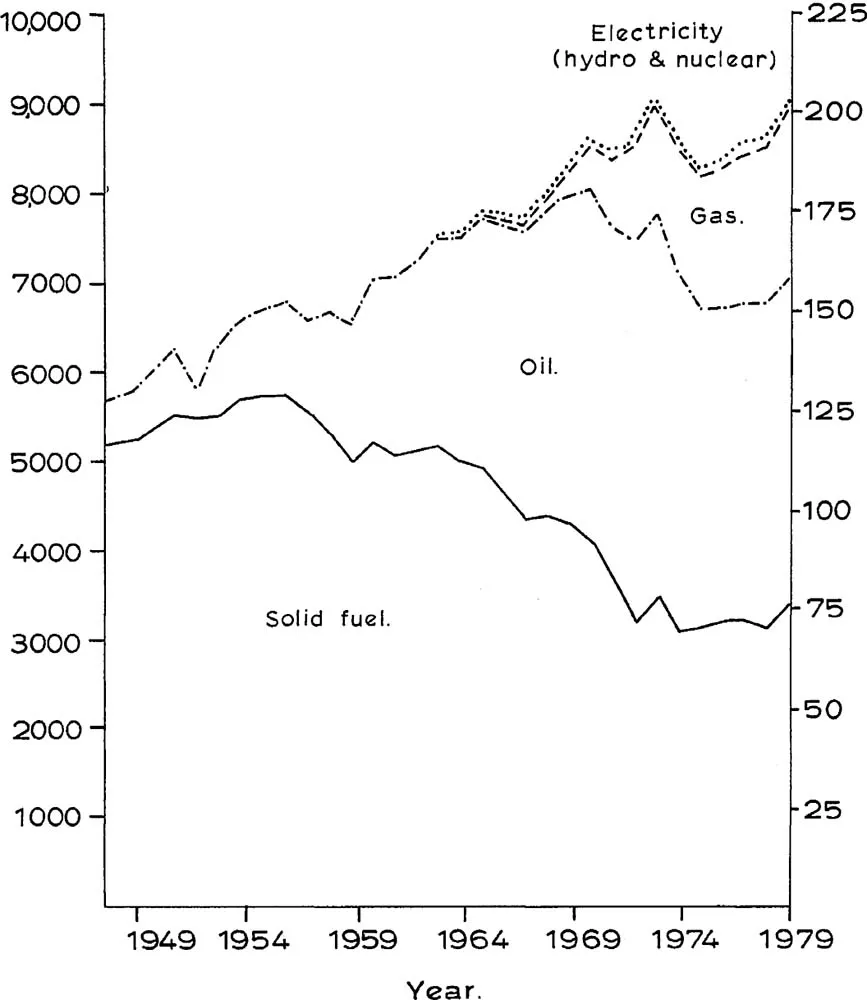
Figure 1.2 Primary energy consumption, 1948–79
The pattern of decline in the importance of coal and the increase in the share of other fuels outlined above reflect changes in the final demand for primary and secondary fuels. The final demand for coal in the Domestic Sector started to fall in 1963, and by 1979 was one-third the level in 1948 (Figure 1.5). The demand for oil rose to a peak in 1973 but has fallen back slightly since then owing to the rise in oil prices. Gas has captured by far the largest share of the domestic sector energy market reflecting its price advantage over its main rival, electricity. The demand for electricity continued to grow steadily up to 1974 but has been erratic since then, owing to higher prices. In the Iron and Steel Sector (Figure 1.6), solid fuel remained the dominant fuel but its consumption had fallen to less than half the 1948 consumption by 1979. Oil consumption reached a peak in 1970 but since then has declined sharply to less than half the 1970 level. Final demands in the Other Industry Sector and Commercial and Other Sectors (Figures 1.7 and 1.8) show a familiar pattern, with declining consumption of coal and rising consumption of the three other fuels, but a fall in oil consumption after 1973 in response to higher oil prices. In the Transport Sector (Figure 1.9), coal was the most important fuel in 1948, but by 1979 over 99 per cent of total energy consumed was oil, with small amounts of electricity (mainly railways) and even less coal. It is worth noting that after the 1973 oil price increase, there was a relatively modest fall in oil consumption which has since been restored.
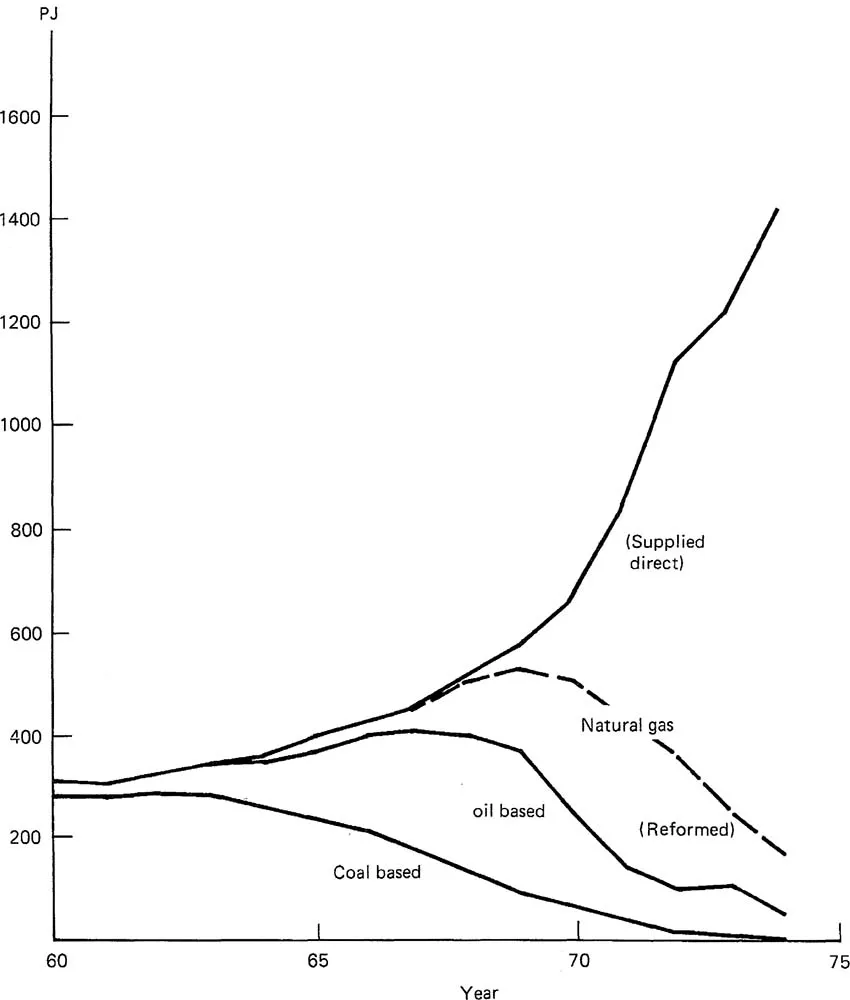
Figure 1.3 Gas supply by source, 1960–74

Figure 1.4 Uses of Coal, 1948–79

Figure 1.5 Domestic Sector annual energy demand, 1948–79

Figure 1.6 Iron and Steel Sector annual energy demand, 1948–79

Figure 1.7 Industrial Sector annual energy demand, 1948–79

Figure 1.8 Commercial Sector annual energy demand, 1948–79

Figure 1.9 Transport Sector energy demand, 1948–79

Figure 1.10a Annual total final energy demand, 1948–79

Figure 1.10b Annual total final energy demand (cumulative), 1948–79
Total final consumption of secondary fuels (aggregated over the five sectors) is shown in Figures 1.10a and b. It is evident that by 1979 the UK had completed a dramatic transition from a one-fuel economy to a four-fuel economy. Recent changes in relative prices of fuels and likely future changes in prices and conditions of demand and supply suggest that equally dramatic changes in the UK energy economy are to be expected during the next few decades.
1.4 Present and Future Reserves of Fuels
Britain presently has resources of all three major fossil fuels (Figure 1.11), but their precise extent is unknown. There is probably between 35 and 80 trillion cubic feet of natural gas which at the 1979 rate of consumption would last for between twenty and forty-five years. Total recoverable reserves of oil originally in place on the UK Continental Shelf are estimated to be within the range 2,400 and 4,400m. tonnes, which at the 1979 rate of annual oil consumption would last for between thirty and fifty years. Technically and economically recoverable reserves of coal are estimated to stand at 45,000m. tonnes which would be adequate to meet UK demand at the 1979 consumption level for seventy years. Additional geological resources of coal in place are estimated to be 120,000m. tonnes. (Unless explicitly referenced, the sources for the estimates in this section are given in Chapter 4.)
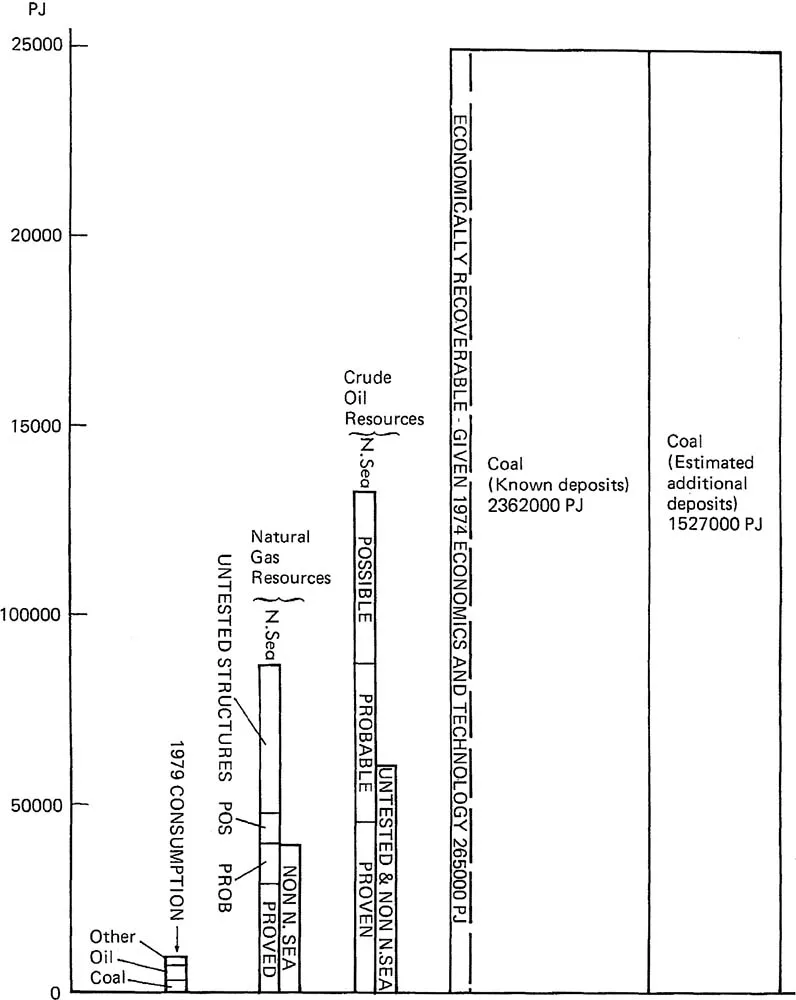
Figure 1.11 Some estimates of UK fossil fuel resources, 1974
In the world as a whole, world oil reserves were estimated in 1977 at about 75,000m. tonnes, sufficient for twenty-five years at 1977 consumption rates (World Energy Conference, 1978). Coal reserves (technically and economically recoverable, not geological reserves in place) were estimated at 430,000m. tonnes, sufficient for 174 years. The world proved reserves of natural gas were estimated to be adequate for approximately fifty years at the annual...
Table of contents
- Cover
- Half Title
- Title Page
- Copyright Page
- Original Title Page
- Original Copyright Page
- Contents
- List of Figures
- List of Tables
- Energy Units and Fuel Equivalents
- Preface
- 1 UK Energy Sector: Past, Present and Future
- 2 Survey of Energy Models
- 3 The Birmingham Energy Model: General Description
- 4 The Birmingham Energy Model: Mathematical Formulation and Data
- 5 Base Case Results
- 6 Base Case Sensitivity Analyses
- 7 International Trade Policy Considerations
- 8 Conservation
- 9 Non-nuclear Futures
- 10 Variable Demand
- 11 Summary, Updating and Conclusions
- Notes on the Authors
- Index
Frequently asked questions
Yes, you can cancel anytime from the Subscription tab in your account settings on the Perlego website. Your subscription will stay active until the end of your current billing period. Learn how to cancel your subscription
No, books cannot be downloaded as external files, such as PDFs, for use outside of Perlego. However, you can download books within the Perlego app for offline reading on mobile or tablet. Learn how to download books offline
Perlego offers two plans: Essential and Complete
- Essential is ideal for learners and professionals who enjoy exploring a wide range of subjects. Access the Essential Library with 800,000+ trusted titles and best-sellers across business, personal growth, and the humanities. Includes unlimited reading time and Standard Read Aloud voice.
- Complete: Perfect for advanced learners and researchers needing full, unrestricted access. Unlock 1.5M+ books across hundreds of subjects, including academic and specialized titles. The Complete Plan also includes advanced features like Premium Read Aloud and Research Assistant.
We are an online textbook subscription service, where you can get access to an entire online library for less than the price of a single book per month. With over 1.5 million books across 990+ topics, we’ve got you covered! Learn about our mission
Look out for the read-aloud symbol on your next book to see if you can listen to it. The read-aloud tool reads text aloud for you, highlighting the text as it is being read. You can pause it, speed it up and slow it down. Learn more about Read Aloud
Yes! You can use the Perlego app on both iOS and Android devices to read anytime, anywhere — even offline. Perfect for commutes or when you’re on the go.
Please note we cannot support devices running on iOS 13 and Android 7 or earlier. Learn more about using the app
Please note we cannot support devices running on iOS 13 and Android 7 or earlier. Learn more about using the app
Yes, you can access Energy Strategies for the UK by Stephen Littlechild,Kirit Vaidya,S. C. Littlechild,K. G. Vaidya in PDF and/or ePUB format, as well as other popular books in Business & Business General. We have over 1.5 million books available in our catalogue for you to explore.