
- 312 pages
- English
- ePUB (mobile friendly)
- Available on iOS & Android
eBook - ePub
About this book
This volume focuses on alternatives for non-metropolitan economic development in the new international economic climate. It provides critical reviews of popular employment-generation alternatives for rural areas.
Trusted by 375,005 students
Access to over 1.5 million titles for a fair monthly price.
Study more efficiently using our study tools.
Information
1
The Rural Economic Gap: Fact or Fiction?
Introduction
It is argued in the recent economic development literature that economic differences between vibrant metro areas of the United States and laggard rural hinterlands are not only large but expanding (Drabenstottand Gibson 1988; Gamick 1989; Reich 1988; and Reid 1989). Yet, per capita income and other indicators of economic vitality should converge over the economic landscape as resources move to regions where their rates of return are highest. Wage rates should converge as labor migrates to areas where wages are high and from regions where wages are low. All else the same, these labor flows should reduce regional wage differentials over time because of the implied shifts in the labor supply schedules. Similar arguments can be made for capital flows and thus, as Borts and Stein (1964) argue, per capita incomes should converge under the neoclassical paradigm of regional growth.
A variety of explanations have been proposed for the widening of the urban-rural economic gap over the last decade. These include:
- The increased strength of international forces in product and factor markets has put some of rural America’s economic bases in jeopardy. Exports from traditional rural economic bases (agriculture, forestry, energy, labor-intensive manufacturing) are especially sensitive to international competition.
- The trend toward high-tech manufacturing and a service-based economy is benefiting metro areas more than rural America. Regional dynamics are influenced by processes that yield large economic benefits to urban places that have established a foothold in the production of newer products and especially producer services. At the same time, more traditional manufacturing operations move down the life cycle and seek production locations in third world areas.
- There is a slowing in the long-run adjustments in labor and capital flows in response to changing rates of return to investment in rural and urban places. The forces of catching-up are slowing because the easiest transfers of capital and labor were completed by the late 1960s making additional catching-up more difficult.
- Demographic shifts over the past several decades have several important implications for the rural-urban gap. More retirees moving to rural areas may produce fast population growth without comparable income growth. And, many of the jobs created in retiree destination rural areas are in low-wage consumer service occupations.
Given these events of the past decade, are there reasons to expect convergence between rural and urban incomes? The purpose of this chapter is to address this issue. First, evidence is presented that suggests the existence of a metro-nonmetro gap in earnings and employment, as well as income. Next, the conceptual issues in the convergence-divergence process are reviewed with a focus on implications for growth in rural America. An outlook for how areas might adapt to the dynamic economic forces is provided in the summary.
Metro and Nonmetro Economic Trends
Though much attention has focused on farm problems in the 1980s, the economic problems now facing rural America encompass more than just agriculture. The economies of rural America are more diverse than usually recognized. Manufacturing forms its economic backbone, contrary to the popular notion that rural counties depend mostly on farming. Counties depending on manufacturing accounted for about 36 percent of nonmetro personal income and population in 1984, triple the farm share. Counties dependent on government, retirement, and trade also each accounted for about the same proportion (about 12 percent) of rural population, income, and employment as farm-dependent counties (Henry et al. 1988).1
Rural Per Capita Incomes
Per capita income differs substantially between rural and urban counties. Metro counties of the United States had income levels averaging $19,885 per capita in 1990. Nonmetro per capita income averaged about 73 percent of this level, $ 14,559. Per capita income does vary somewhat between rural areas, but far less than between metro counties and any of the rural county groups.2 Has the per capita income gap been increasing or decreasing in recent years? Two periods appear to have been particularly important over the past two decades. First, from 1969 to 1973 the gap in per capita incomes between metro and nonmetro areas narrowed, with rural income rising from 71 percent of urban income in 1969 to 78 percent in 1973. But, from 1973 to 1990, the gap narrowed no further. Instead, it widened over the 1980s, with the ratio falling to about 73 percent through 1990.3
All Rural Areas Gain in the Early1970s. The most dramatic gains in 1969-1973 were made in farming and mining counties. Farm-dependent counties moved from 72 percent of the metro per capita income level in 1969 to 90 percent in 1973. Mining counties increased their incomes from 65 percent of the metro level in 1969 to 76 percent in 1973. Rural counties where manufacturing dominates made less dramatic improvement, but they still raised their incomes from about 73 percent of the metro level in 1969 to about 76 percent in 1973. Similar growth was seen in the other major groups of nonmetro counties, those dependent on government, trade, or retirement activities. Income in each of these county groups grew from about 70 percent of the metropolitan per capita income average in 1969 to the 74 to 78 percent range in 1973 (Henry et al. 1988).
Metro Areas Spurt Ahead of Rural America. From 1973 to 1987, when the overall income gap was widening, some types of nonmetro counties fared better than others. However, none were able to improve their relative well-being from the 1973 high. None of the rural county types have had significant improvements in their per capita incomes relative to urban areas since 1973 (Henry et al. 1988).4
The most dramatic drop was in farm counties, where real per capita income fell from 90 percent of the metro level in 1973 to 74 percent in 1986. Incomes in manufacturing counties started the period at 74 percent of the metro level and changed little through the 1980s.
Relative per capita income in mining counties fluctuated during the period but ended 1986 at about 67 percent, only slightly above the 65 percent in 1969. Government and trade counties also showed little net change from their 1969 positions. Government counties had about 69 percent of the metro income level in 1969 and 70 percent in 1986, while trade counties maintained about 70 percent of the metro income level from 1969 through 1986.
Earnings and Unemployment Trends
Real per capita income reflects the average well-being of the population. To assess the overall vitality of the rural economy, however, other measures of economic activity are needed. Two additional measures are earnings per capita in rural versus urban places and unemployment rates. Earnings per capita is a measure of the vitality of the local economy that nets out the transfer payments, dividends, interest, and rents from other income. As such, the earnings measure yields a more accurate measure of the role that the local economy plays in providing income to its residents. Unemployment rates indicate how effectively the local economy provides employment opportunities for those that want to work at prevailing wage rates in different occupations. High unemployment rates may also indicate a mismatch between local mixes of employee skills needed and those offered by the local labor force.
Earnings Per Capita. The gap between rural areas and urban areas is more pronounced in terms of per capita earnings than for per capita income. Looking first at Figure 1.1, note that from 1969 to 1973 there was relatively little difference between the earnings and income measures of well-being in the rural versus urban places.5 In 1969, rural places had per capita income and earnings about 71 percent of the urban level. Both indicators rose to about 78 percent in 1973; then, a steady decline in these measures began. However, while rural per capita incomes fell to about 72 percent of the urban levels in 1986, the earnings gap fell to about 66 percent in 1986. Since 1973, rural residents and economies have increased their dependence—relative to urban places—on transfer payments and dividends, rent and interest. This is another indication of an increasing gap between the vitality of urban and rural America. Even in the nonmetro retirement counties—where per capita income has kept pace with metro places—the earnings gap has widened from about 70 percent in 1973 to about 63 percent in 1986 as illustrated in Figure 1.2. In manufacturing and agriculturally dependent rural counties, the earnings gap with metro areas increased more than the income gap (Figures 1.3 and 1.4).
An earnings gap between nonmetro and metro counties that is larger than the per capita income gap means that there are net transfer payments—and perhaps dividends, interest and rent net transfers—from metro places to rural areas. These data support the view of a rural America increasingly dependent on the vitality of metro growth centers.
However, it is also reasonable to expect metro centers to be concerned more about the vitality of their lagging central cities than the surrounding hinterlands. Indeed the large numbers of unemployed in central cities is a policy problem that competes effectively with the problem of lagging rural areas for public attention.
Rural Versus Urban Unemployment. Looking first at Figure 1.5, rural unemployment rates are shown to increase faster than those in metro areas since 1976, and they have been higher than the urban rates from 1978 through 1987.6 While nonmetro unemployment rates were only about 90 percent of the metro rate in 1976, the relative position of nonmetro counties has steadily worsened in the 1980s. The 1987 nonmetro unemployment rate is about 135 percent of the metro level. If the comparison is between the core counties of very large metro areas—presumably the metro areas with substantial unemployment problems—the nonmetro unemployment rates were still about 132 percent of the core metro level in 1987. And, the pattern of steady relative deterioration since 1976 holds for the nonmetro to metro core counties. Looking next at the comparison between metro fringe counties—the suburban areas of the large metro regions that have fared best among the metro counties—then the nonmetro unemployment rates were almost 170 percent of the metro fringe rates in 1987. And, the nonmetro rates have risen more rapidly since 1982 relative to the fringe metro counties.
As shown in Figure 1.6, nonmetro places have fared little better when compared with unemployment in medium-sized metro counties. Rural areas still have unemployment rates about 130 percent of the medium metro counties, and the
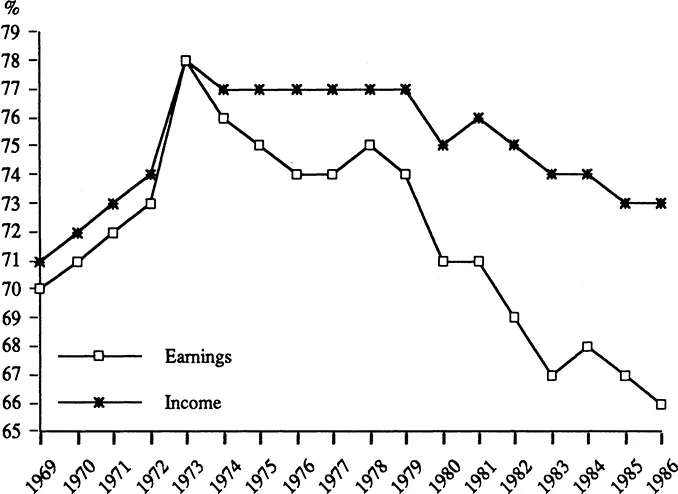
Figure 1.1. Ratio of nonmetropolitan to metropolitan per capita income and earnings.
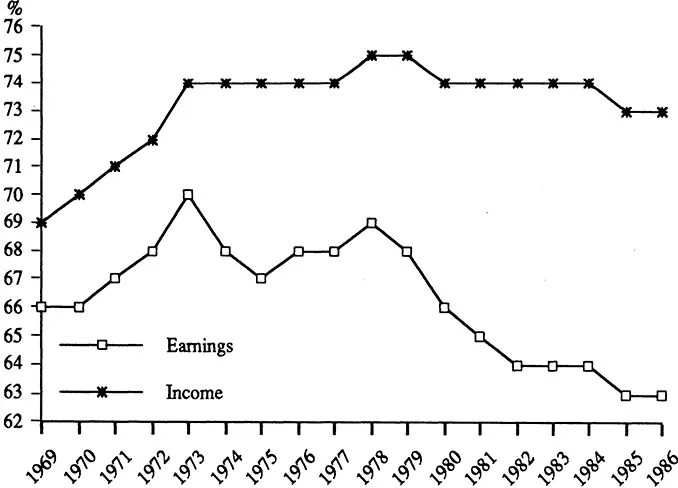
Figure 1.2. Ratios of nonmetropolitan retirement counties to metropolitan counties per capita income and earnings.
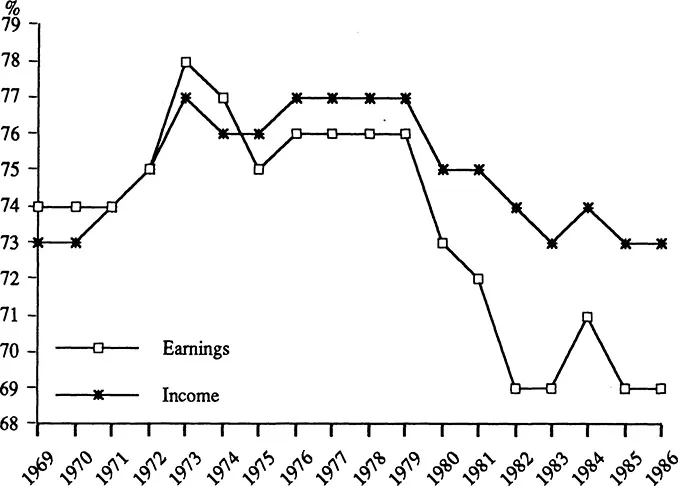
Figure 1.3. Ratios of nonmetropolitan manufacturing counties to metropolitan counties per capita income and earnings.
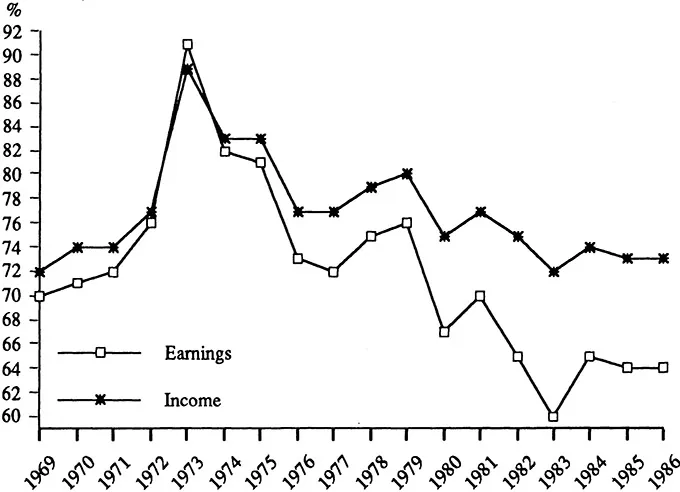
Figure 1.4. Ratios of nonmetropolitan agricultural counties to metropolitan counties per capita income and earnings.
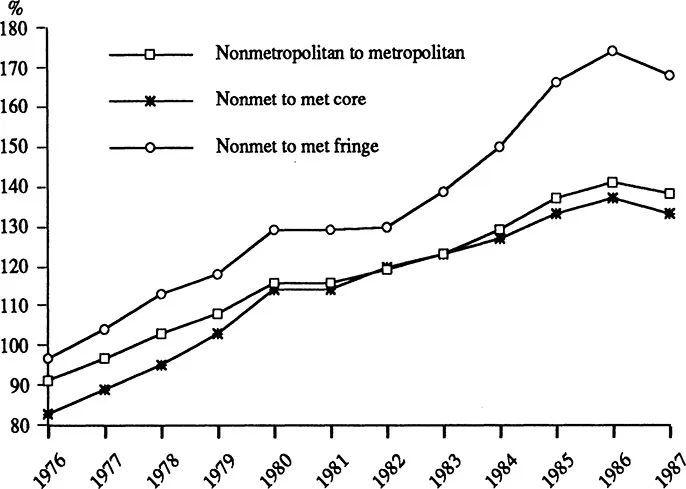
Figure 1.5. Ratio ofnonmetropolitan to metropolitan unemployment rates: nonmetropolitan versus the metropolitan c...
Table of contents
- Cover
- Half Title
- Series Page
- Title
- Copyright
- Contents
- Foreword
- Acknowledgments
- About the Contributors
- Introduction
- 1 The Rural Economic Gap: Fact or Fiction?
- 2 Manufacturing Decentralization: Has the Filtering-Down Process Fizzled Out?
- 3 Utilization of Rural Labor Resources
- 4 Endogenous Growth Centers: Lessons from Rural Denmark
- 5 Small and Midsize Enterprise Development: Prospects for Nonmetropolitan Areas
- 6 Service Industries in the Rural Economy: The Role and Potential Contributions
- 7 Attracting Retirees as a Development Strategy
- 8 The Potential for Tourism Development in Nonmetropolitan Areas
- 9 High-Tech Manufacturing: Problems and Prospects
- 10 Nontraditional Agriculture: An Economic Development Alternative
- 11 Foreign Direct Investment: Prospects for Employment Generation in Nonmetropolitan Areas
- 12 State and Local Government Policies
- 13 Removing Rural Development Barriers Through Telecommunications: Illusion or Reality?
- 14 Cross-Hairs Targeting for Industries and Occupations
- 15 Rural Development Policy Options
Frequently asked questions
Yes, you can cancel anytime from the Subscription tab in your account settings on the Perlego website. Your subscription will stay active until the end of your current billing period. Learn how to cancel your subscription
No, books cannot be downloaded as external files, such as PDFs, for use outside of Perlego. However, you can download books within the Perlego app for offline reading on mobile or tablet. Learn how to download books offline
Perlego offers two plans: Essential and Complete
- Essential is ideal for learners and professionals who enjoy exploring a wide range of subjects. Access the Essential Library with 800,000+ trusted titles and best-sellers across business, personal growth, and the humanities. Includes unlimited reading time and Standard Read Aloud voice.
- Complete: Perfect for advanced learners and researchers needing full, unrestricted access. Unlock 1.5M+ books across hundreds of subjects, including academic and specialized titles. The Complete Plan also includes advanced features like Premium Read Aloud and Research Assistant.
We are an online textbook subscription service, where you can get access to an entire online library for less than the price of a single book per month. With over 1.5 million books across 990+ topics, we’ve got you covered! Learn about our mission
Look out for the read-aloud symbol on your next book to see if you can listen to it. The read-aloud tool reads text aloud for you, highlighting the text as it is being read. You can pause it, speed it up and slow it down. Learn more about Read Aloud
Yes! You can use the Perlego app on both iOS and Android devices to read anytime, anywhere — even offline. Perfect for commutes or when you’re on the go.
Please note we cannot support devices running on iOS 13 and Android 7 or earlier. Learn more about using the app
Please note we cannot support devices running on iOS 13 and Android 7 or earlier. Learn more about using the app
Yes, you can access Economic Adaptation by David L Barkley in PDF and/or ePUB format, as well as other popular books in Business & Business General. We have over 1.5 million books available in our catalogue for you to explore.