![]()
Section III
Measuring Economic and Social Values, Benefits, and Impacts
Methods and Implementation Examples
![]()
10
A Review of Socioeconomic Evaluation Methods and Techniques
Alan Smart, Andrew Coote, Ben Miller, and Richard Bernknopf
CONTENTS
10.1 Introduction
10.1.1 Methodology
10.1.2 The Meaning of Value
10.2 Current State of the Art
10.2.1 Welfare Analysis
10.2.1.1 Application to Fundamental Geospatial Data
10.2.1.2 Issues with Welfare Analysis
10.2.2 Estimates of Gross Revenue
10.2.3 Value-Added Approaches
10.2.3.1 Value Added Along Supply Chains
10.2.3.2 Value Chain Analysis
10.3 Economic Impact Assessment
10.4 Economic Impact Methodologies
10.4.1 Benefit–Cost Analysis
10.4.2 The Benefit–Cost Analysis Process
10.4.3 Valuation of Tangible Benefits
10.4.3.1 Direct Benefits
10.4.3.2 Indirect Benefits—Defensive Expenditure or Substitute Cost Approaches
10.4.4 Valuation of Nonmarket (Intangible) Benefits
10.4.4.1 Methods for Calculating Nonmarket Benefits
10.4.5 Multi-Criteria Analysis
10.4.6 Computable General Equilibrium Modeling
10.4.7 Input–Output Multiplier Analysis
10.4.8 Real Options
10.5 Comparison of Methodologies
10.6 Case Studies
10.6.1 Benefit–Cost Analysis of the National Map
10.6.2 Value of Spatial Information in Catalonia
10.6.3 Value of a Spatial Data Infrastructure in Lombardy
10.6.4 Value of Remote Sensing from LANDSAT
10.6.5 Value of Remote Sensing from Space for Decision-Making
10.7 Summary
10.8 New and Emerging Techniques
References
10.1 Introduction
This chapter reviews methodologies in economics for valuing the benefits of geospatial data and services. It explores the meaning of socioeconomic value and reviews the methodologies underpinning value assessments. It explains the theoretical background to economic welfare, gross revenue, and value-added analyses. Different methods for economic impact assessment are discussed. These include benefit–cost analysis, and Computable General Equilibrium (CGE) modeling. Examples of the application of these techniques are discussed, and the issues that arise when applying these techniques are canvassed. It notes that the methodology selected should be appropriate to the context in which it is to be applied, including the decision support required by policy-makers and suppliers of geospatial data.
10.1.1 Methodology
The use and application of geospatial information have delivered significant economic and social benefits to society. It is anticipated that these benefits will increase in future as geospatial information is further integrated into emerging data systems and technologies.
Understanding the value of geospatial information has become important to decision-makers in government and private organizations to support the case for investment in and maintenance of spatial data infrastructure (SDI). It is also important for policy development with respect to the capture, curation, and dissemination of geospatial data. Most significantly, it underpins the understanding of the importance of geospatial infrastructure to society in general.
Numerous valuations of geospatial information have been undertaken over past 20 years. These have drawn on varying techniques, including economic welfare theory, gross revenue estimates, value-added analysis, and general equilibrium modeling. Each methodology has advantages and disadvantages.
It is important for policy-makers and decision-makers alike that the general economic principles underlying the different valuation techniques are understood. This chapter canvasses the main economic principles underlying these techniques and discusses their application in practice.
10.1.2 The Meaning of Value
Assessing the value of geospatial information is a complex task. Valuing the contribution made by open geospatial data provided at no cost is even more complex, because there is no market in which it can be bought or sold.*
A starting point for estimating its value is to clarify what is meant by the term value. Fundamental geospatial data are intermediate goods that enable other activities through value-added services. To understand their value, we need to explore the value that suppliers and users draw from the data.
For a government agency, this could be as narrow as a financial benefit (e.g., realized future savings). For a policy decision-maker, it could be as wide as the expected benefits that would accrue to society as a whole from the use of the data.
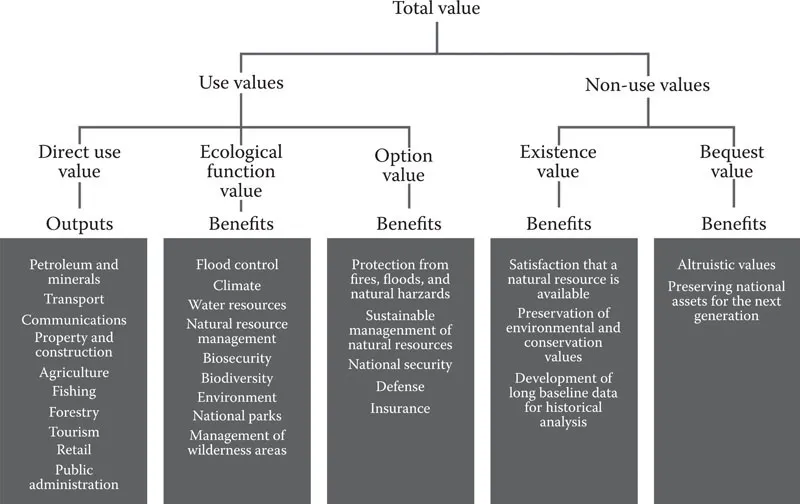
A suggested framework for considering different concepts of value is provided in Figure 10.1. Values are divided into use and non-use values. Use values comprise direct use values (such as the value of goods and services), ecological values (such as biodiversity or sustainable rivers and streams), and option values (such as insurance against the costs of natural disasters).
FIGURE 10.1
The nature of socioeconomic value. (Based on a conceptual framework from Young, 1992. With permission.)
Non-use values can be considered as existence values (valuing the existence of a coral reef but never visiting it) and bequest values (preserving the value of assets for later generations). Although non-use values are conceptual, they are real in the minds of many in society and potentially become policy issues for this reason.
There is also a long history of valuation of intangible benefits derived from geospatial data by using willingness-to-pay methodologies.
There has been limited use of option valuation in assessing the value of geospatial applications; however, there are examples in areas such as astronomy and research and development. There appears to be little in the way substantive studies of non-use values for geospatial information in the literature.
10.2 Current State of the Art
Several techniques have been applied over the past 20 years to estimate the value of geospatial information. A representative sample is discussed in the following sections.
10.2.1 Welfare Analysis
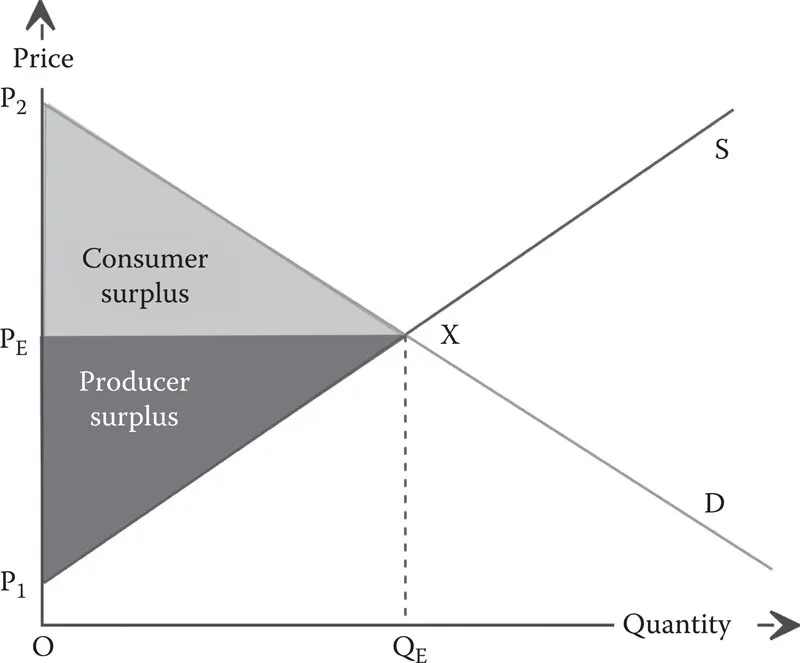
Welfare analysis is a theoretical conceptual economic model that describes the economic value of a good or a service. In an efficient market, the economic welfare of a good or a service to society is measured by consumer and producer surplus. The conceptual base for consumer and producer surplus is the supply and demand or the market model depicted in Figure 10.2.
The market supply curve (which comprises the summation of individual firm supply curves) indicates the costs of extra production, that is, the costs to society of producing an extra unit of a good or service. Firms aim to operate on the upward sloping part of their marginal cost curve, above the minimum average variable cost. The upward slope reflects diminishing returns to factor inputs, which means that it costs more to produce each additional unit of output.
The market demand curve (which comprises the summation of individual demand curves) indicates the maximum amount that consumers are willing to pay for incremental increases in the quantity of the good or service. The demand curve slopes downward to the right because more consumers are willing to purchase the good as the price falls. This concept is generally known as diminishing marginal utility.
FIGURE 10.2
Standard concepts of producer and consumer surplus. (From Marshall, 1890; Hanley, 1997. With permission.)
The interaction of demand and supply determines the market price (PE) for a good and the quantity that is produced in any given time period (QE).
This market model provides the basis for identifying and estimating the net economic value to consumers and producers, referred to as consumer surplus and producer surplus, respectively.
Consumer surplus is the difference between what consumers would be willing to pay for a good or service (the total benefit to the consumer) and what they have to pay (the cost to consumers). In Figure 10.2, consumer surplus is represented as the area between the demand curve and the price line (P2XPE).
Producer surplus is the difference between the revenue received for a good or a service (total benefit to producers) and the costs of the inputs used in the provision of the good or the service* (economic cost to producers). In practical terms, it is the net revenue (before tax) that is earned by a producer of goods and services. In Figure 10.2, it is the area between the price line and the supply curve (P1XPE). If the diagram is specified in annual terms, the sum of the shaded areas will represent the annual value of the product to society.
10.2.1.1 Application to Fundamental Geospatial Data
The application of the economic welfare theory to empirical analysis of the value of fundamental geospatial data requires many assumptions about the real nature of the markets under examination. Its application to decision support for investment in geospatial data must account for two important issues. First, the custodian of the data is generally a government organization, where the price for access is set by a policy decision—not by the market. Second, the data can exhibit public good characteristics, which has implications for the value that is generated for society.
Under an ideal open data policy, the price for fundamental spatial data would be set at the marginal cost, which is close to or equal to zero when supplied through web-based applications. This is illustrated in Figure 10.3. The value to consumers of this arrangement is the consumer surplus, shown as the shaded area in the diagram.
Welfare analysis has been used on a number of occasions to estimate both the value of geospatial data services in general and the relative economic benefit of different pricing policies.
Pollock (2008) estimated the value of moving from average cost pricing to marginal cost in a report prepared for HM Treasury; the theoretical framework used by Pollock is illustrated in Figure ...