This book is designed to acquaint serious students, scientists, and clinicians with magnetic source imaging (MSI)--a brain imaging technique of proven importance that promises even more important advances. The technique permits spatial resolution of neural events on a scale measured in millimeters and temporal resolution measured in milliseconds. Although widely mentioned in literature dealing with cognitive neuroscience and functional brain imaging, there is no single book describing both the foundations and actual methods of magnetoencephalopgraphy and its underlying science, neuromagnetism. This volume fills a long-standing need, as it is accessible to scientists and students having no special background in the field, and makes it possible for them to understand this literature and undertake their own research.
A self-contained unit, this book covers MSI from beginning to end, including its relationship to allied technologies, such as electroencephalography and modern functional imaging modalities. In addition, the book: *introduces the field to the non-specialist, providing a framework for the rest of the book; *provides a thorough review of the physiological basis of MSI; *describes the mathematical bases of MSI--the forward and inverse problems; *outlines new signal processing methods that extract information from single-trial MEG; *depicts the early, as well as the most recent versions of MSI technology; *compares MSI with other imaging methodologies; *describes new paradigms and analysis techniques in applying MSI to study human perception and cognition, which are also applicable to EEG; and *reviews some of the most important results in MSI from the most prominent researchers and laboratories around the world.
Trusted by 375,005 students
Access to over 1.5 million titles for a fair monthly price.
Basics of Neuromagnetism and Magnetic Source Imaging
Lloyd Kaufman
New York University
Zhong-Lin Lu
University of Southern California
This chapter provides an overview of neuromagnetism, which is defined as the study of magnetic fields associated with the electrical activity of neurons. Like the other chapters in this volume, this chapter especially emphasizes the magnetic fields generated by the human brain. In view of this emphasis, we introduce the reader to magnetoencephalography, a technique that measures the external magnetic field, near the scalp, of the intact human brain. This general overview is designed to help newcomers appreciate the more technical chapters. It provides a relatively nontechnical description of the physical basis of the neuromagnetic field, the different methods used to detect it, and how the magnetoencephalogram complements the electroencephalogram. We explain how analysis of MEG data can yield high temporal and reasonable spatial resolution “representations” of current distributions on the cerebral cortex. These magnetic source images complement the other functional imaging modalities. Furthermore, we describe some typical uses of magnetic source imaging in medicine and in cognitive neural science. Finally we briefly discuss complementary modes of functional brain imaging; such as positron emission tomography and functional magnetic resonance imaging, as well as recent attempts to combine multiple imaging modalities to achieve high spatiotemporal resolution functional images of the human brain.
One goal of this chapter is to acquaint readers with areas of research that are awaiting the attention of creative scientists. To achieve this goal, we must make a seemingly esoteric subject accessible. Hence; this chapter does not provide an exhaustive review of the literature; instead? we attempt to elucidate relevant principles, methods, and results in as simple a manner as possible and point the way so that even beginners will recognize opportunities to make advances in the field. The other chapters in this volume cite the relevant literature and describe historical precedents in great detail and can serve as a basis for further study and research. Thus, one of our major goals is to prepare beginners to read these chapters.
THE NEUROGENESIS OF MAGNETOENCEPHALOGRAPHY
In chapter 2 of this volume? Yoshio Okada provides a detailed discussion of how neurons give rise to magnetic fields. In this section we offer a brief and simplified account.
Primary and Volume Currents
Neurotransmitters crossing a synapse produce local changes in the electric potential across the target membrane. This postsynaptic potential tends to be either excitatory or inhibitory; that is, it either reduces or increases the polarization of the target membrane, depending on the nature of the neurotransmitter. The interior resting voltage of the cell is normally negative with respect to its exterior. As the polarization of the membrane is reduced, or even reversed, near the synapse the internal potential of the cell membrane becomes less negative relative to that of more distant regions of the membrane. This difference in potential between one region of the cell’s inner wall and that of more distant regions results in current flow. Conversely when the local transmembrane potential is increased (hyperpolarized) so that negativity of the interior of the membrane is greater near the synapse relative to more distant regions; negative ions will tend to flow away from that region toward more distant portions of the cell This intracellular ionic current flow may persist for a relatively long time. The entire neuron can be thought of as a very small battery and a resistor connected to its positive pole. The battery-resistor combination is immersed in a saline solution. Because the solution is a conductor, it completes the circuit between the (positive) end of the resistor and the negative pole of the battery. This allows ionic current to flow widely throughout the solution from the positive end of the resistor to the opposite (negative) pole of the battery. The positive end of the resistor tends to lose charge as negative ions flow from it into the saline medium. This charge is replaced by ions from within the battery. These negative ions inside the battery are replenished in turn by inflowing ions from the medium. As a consequence; charge is conserved, because there is a continuous flow of current around the complete battery-resistor-medium circuit. We refer to the intracellular current, within the battery and resistor, as the primarycurrent. The primary current represents the ionic currents flowing within elongated processes of neurons, for example, dendrites of pyramidal cells of the cerebral cortex. Alternatively the currents flowing outward from the battery-resistor circuit into the saline solution and inward from that solution toward the circuit’s opposite pole are referred to as the volume currents. These currents correspond to extracellular currents that flow within the cerebrospinal fluid throughout the intracranial space. Because the skull has very high electric resistance, volume currents flow through the orbits of the eyes and other openings in the skull into the scalp, where they create the potential differences that underlie the electroencephalogram (EEG). The magnetic fields surrounding the neurons pass undisturbed through the skull to produce the magnetoencephalogram (MEG).
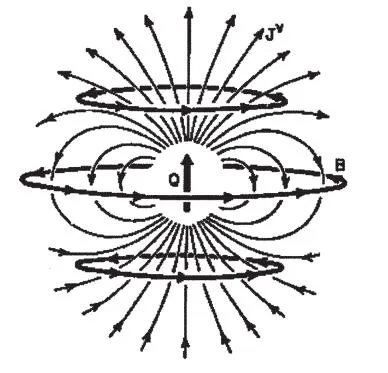
Both the volume currents and the intracellular ionic currents are depicted schematically in Fig. 1.1. In this instance, we assume that the source of the magnetic field B is a segment of current that is very small relative to the distance at which the field is measured. Hence, it is possible to model it as an equivalent current dipole (ECD). Because magnetic fields are superimposable (i.e., they are additive and do not interact with each other), extracranial fields do not arise from a single neuron but actually represent the sum of the fields of many similarly oriented hypercolumns of concurrently active cortical cells.
In Fig. 1.1,
,where I is the amplitude of the current and
is the length and direction of the current segment. Because the dipole has both direction and strength, Q is a vector quantity representing the strength of the dipole in ampere-meters (the dipole’s moment). The volume current also varies in strength and direction. The symbol Jv indicates that the value of the direction and strength of the volume current depends on the position at which it is measured.
All moving electric charges are accompanied by magnetic fields. Because the volume currents are composed of moving electric charges, these too must be accompanied by magnetic fields. However, when the dipole is immersed in an infinitely large volume (or in a finite sphere), the direction
FIG. 1.1. A current dipole immersed in a homogeneous conducting medium. The magnetic field (B) is due solely to the current dipole (moment=Q), with the volume currents (represented by the thin lines [Jv]) making no contribution to the field.
of the field associated with an ion at one place and time is opposite from that associated with ions at other places at the same time. Therefore, the fields of these oppositely directed moving charges cancel each other out, that is, the sum of the fields of the volume current measured at some distant point is effectively zero. Thus, the field measured at a distance is due solely to the net primary current, which is largely associated with postsynaptic dendritic potential changes.
A distinction is often made between open-field and closed-field neurons. The latter are so designated because their dendritic trees are approximately symmetrical in three dimensions. Because of their morphological symmetry, these cells are presumed to contribute little to either electric or magnetic fields detected some distance away, because the net electric and magnetic fields produced by symmetric current distributions are zero. For example, basket cells are sometimes described as closed-field cells. On the other hand, pyramidal cells are prototypical open-field neurons, because their apical dendrites incorporate one-dimensional elongated processes. Ionic currents within these dendrites are excellent candidate sources of external fields and potentials. However, one must bear in mind that cell morphology alone does not determine whether a cell’s magnetic field is detectable at a distance. For a cell with a symmetric dendritic tree, there could still be an asymmetric distribution of primary current (e.g., due to asymmetric presynaptic activities) and therefore a field that can be detected at a distance. Thus, although the literature often implies that pyramidal cells are the sole sources of external fields; this claim has not been proved. For example, stellate cells do not have elongated dendrites. They, and not pyramidal cells, are predominant in the visual cortex. Yet some of the strongest MEG (and EEG) signals arise from the visual cortex.
As already noted, the volume currents flowing in the dermis of the scalp create the potential differences that underlie the EEG. Brain tissue and the fluid filling the subarachnoid space are relatively good conductors, especially as compared with the skull, which is highly resistive. These anisotropies in conductivity must be taken into account in attempts to identify the neural sources of scalp-detected potentials (Nunez, 1981). The difficulties in locating neural sources of EEC/event-related potential (ERP) are further compounded by the fact that the skull and other tissues are relatively asymmetrical, so that the paths of flowing volume currents are also asymmetrical. Finally, in measuring the EEG (as well as the ERPs considered later), one must use a reference or ground electrode. This is never a truly indifferent electrode, as it is affected by activity of the brain at regions that may be far from the “active” electrode. One must take this into account in interpreting a pattern of potentials across the scalp. Despite these factors, the EEG is capable of providing vital information regarding the linkage between particular scalp-detected phenomena and underlying process. For example, the presence of the classic spike and wave in the EEG may be diagnostic of epilepsy, even though sometimes it is not possible to accurately determine the location of the lesion responsible for seizures. To take another example, despite early controversy regarding the source of the N100 component of the auditory-evoked potential (AEP), this component proved to be a useful candidate for the study of attention.
To summarize, the scalp is “transparent” to magnetic fields (see chap. 2, this volume) but not to the electric potential produced by the brain. This makes interpretation of MEG a much simpler problem than that of EEG. Even though many recent ERP localization methods attempt to take account of these conductivity problems by using sophisticated volume conductor models of the head, ERP source localization is still a very difficult problem. A good example is in the study of N100, a relatively negative voltage peak (component) in the AEP that occurs about 100 msec after the onset of an acoustic stimulus. (In the MEG literature, the magnetic counterpart to N100 is often referred to as M100.) The AEP is normally detected at a midline electrode (at the vertex). As explained in chapter 9 of this volume, the sources of this component lie within the auditory cortex of each of two hemispheres. MEG experiments have revealed that at least two (and probably more) sources in each hemisphere underlie N100. The sources in the two hemispheres differ in strength and are affected somewhat differently by attention to tonal stimuli (Curtis, Kaufman, & Williamson, 1988). The many published AEP studies do not report this asymmetry. Similarly auditory evoked fields (AEFs) in response to tones of different pitch have sources that occupy different positions along the auditory cortex. The tonotopic organization of the human auditory cortex was first revealed in MEG experiments (Romani, Williamson, & Kaufman, 1982). The tonotopic organization of the human auditory cortex is described by Cosimo Del Gratta and Gian Luca Romani in chapter 10. Other imaging modalities have confirmed this finding. For example, single photon emission tomography has revealed a similar organization of the human auditory cortex (Ottaviani et al., 1997). Similar findings were obtained using functional magnetic resonance imaging (fMRI; Wessinger, Buonocore; Kussmaul, & Mangun, 1997).
Thus far, even after 20 years, this property of the auditory cortex has not been revealed in any AEP study, although an experiment with indwelling electrodes has confirmed the finding (Liegeois-Chauvel et al., 2001). So, even though the ultimate sources of the AEP and the AEF are the same, the two types of measures (MEG and EEG) differ in certain vital respects. We now make these differences clear.
Effect of Source Orientation
For the present it is useful to represent the sources of the MEG and EEG as equivalent current dipoles. Let us assume that the volume currents associated with an ECD underlie the EEG, and the field surrounding the ECD is a source of the MEG.
Many early MEG studies made the simplifying assumption that the head may be represented by a sphere the radius of which is approximately the same as the radius of curvature of the skull over which neuromagnetic measurements are made. As we shall see, this practice is beginning to give way to one in which more realistic head shapes are used (see chap. 3). For the sake of clarity however, we stay with the older and still widely applied practice.
The sphere in Fig. 1.2a is 20 cm in diameter, and a current dipole is located 4 cm beneath its surface. It is very important to note that the current dipole is oriented at a right angle to a radius, that is, it is oriented tangentially with res...
Table of contents
Cover
Half Title
Full Title
Copyright
Contents
Photo
Preface
1 Basics of Neuromagnetism and Magnetic Source Imaging
2 Toward Understanding the Physiological Origins of Neuromagnetic Signals
3 Forward Problem Solution of Magnetic Source Imaging
4 Magnetic Source Imaging: Search for Inverse Solutions
5 Techniques for Investigating and Exploiting Nonlinearities in Brain Processes by Recording Responses Evoked by Sensory Stimuli
6 Independent Components of Magnetoencephalography: Localization and Single-Trial Response Onset Detection
8 Full-Sensitivity Biomagnetometers: Sam Williamson's Vision Brought to Life
9 From 1- to 306-Channel Magnetoencephalography in 15 Years: Highlights of Neuromagnetic Brain Research in Finland
10 Magnetoencephalography: From Pioneering Studies to Functional Brain Imaging
11 Optical Imaging of Brain Function and the Relation Between Neuronal Activity and Hemodynamics in Health and Disease
12 High-Frequency Oscillations From the Human Somatosensory Cortex: The Interneuron Hypothesis
13 Measuring Sensory Memory: Magnetoencephalography Habituation and Psychophysics
14 Clinical Applications of Brain Magnetic Source Imaging
Epilogue: Samuel J.Williamson
Author Index
Subject Index
Frequently asked questions
Yes, you can cancel anytime from the Subscription tab in your account settings on the Perlego website. Your subscription will stay active until the end of your current billing period. Learn how to cancel your subscription
No, books cannot be downloaded as external files, such as PDFs, for use outside of Perlego. However, you can download books within the Perlego app for offline reading on mobile or tablet. Learn how to download books offline
Perlego offers two plans: Essential and Complete
Essential is ideal for learners and professionals who enjoy exploring a wide range of subjects. Access the Essential Library with 800,000+ trusted titles and best-sellers across business, personal growth, and the humanities. Includes unlimited reading time and Standard Read Aloud voice.
Complete: Perfect for advanced learners and researchers needing full, unrestricted access. Unlock 1.5M+ books across hundreds of subjects, including academic and specialized titles. The Complete Plan also includes advanced features like Premium Read Aloud and Research Assistant.
Both plans are available with monthly, semester, or annual billing cycles.
We are an online textbook subscription service, where you can get access to an entire online library for less than the price of a single book per month. With over 1.5 million books across 990+ topics, we’ve got you covered! Learn about our mission
Look out for the read-aloud symbol on your next book to see if you can listen to it. The read-aloud tool reads text aloud for you, highlighting the text as it is being read. You can pause it, speed it up and slow it down. Learn more about Read Aloud
Yes! You can use the Perlego app on both iOS and Android devices to read anytime, anywhere — even offline. Perfect for commutes or when you’re on the go. Please note we cannot support devices running on iOS 13 and Android 7 or earlier. Learn more about using the app
Yes, you can access Magnetic Source Imaging of the Human Brain by Zhong-Lin Lu,Lloyd Kaufman in PDF and/or ePUB format, as well as other popular books in Psychology & Cognitive Neuroscience & Neuropsychology. We have over 1.5 million books available in our catalogue for you to explore.