- 400 pages
- English
- ePUB (mobile friendly)
- Available on iOS & Android
eBook - ePub
Recovery from Stuttering
About this book
This book is a comprehensive guide to the evidence, theories, and practical issues associated with recovery from stuttering in early childhood and into adolescence. It examines evidence that stuttering is associated with a range of biological factors — such as genetics — and psychological factors — such as anxiety — and it critically assesses theoretical accounts that attempt to integrate these findings. Written so that it can be used flexibly to meet the demands of courses about stuttering, the book may be used as a text at the undergraduate or graduate level in psychology or speech-language science.
Tools to learn more effectively

Saving Books

Keyword Search

Annotating Text

Listen to it instead
Information
Section II
Factors Related to Developmental Stuttering Based on Experimental Studies
4
Genetic Factors and Their Impact on Onset and Recovery of Stuttering
Twin studies consistently show around a 70/30 split between heritable and environmental influences, and Dworzynski, Remington, Rijksdijk, Howell, and Plomin (2007) reported that these did not differ across persistent/recovered cases. Ambrose and coworkers (1993, 1997) have argued that there is a single major gene locus for stuttering at onset and that polygenic influences emerge during the later course of the disorder. Kidd and his group (Kidd, Kidd, & Records, 1978) who had also thought that there was a single major locus in their initial work, abandoned this notion subsequently and were firmly of the opinion that stuttering is polygenic and involves a non-Mendelian, sex-modified mode of transmission. Studies with genetic markers, mainly on adults who have persisted in their stuttering, have shown that a variety of different genes are involved, and a study by Suresh et al. (2006) has reported different genes are involved for persistent and recovered speakers.
4.1 INTRODUCTION
Some basic background to three methods that have been employed with people who stutter (twin studies, family history, and molecular genetics) is presented in separate sections below. Recent work using these methods with people who stutter follow the respective background material. It has been established for a long time that stuttering runs in families, which may suggest there is a genetic basis for the disorder (Bryngelson & Rutherford, 1937). Past work has shown that between 23 and 68% of stutterers have family members who stutter compared with 1.3 to 18.1% of control families (Conture, 2001). Twin studies have shown that about 70% chance of stuttering is heritable. Heritability is the proportion of phenotypic variation in a population that is attributable to genetic variation among individuals. Phenotypic variation among individuals may be due to genetic and/or environmental factors. (See section 4.4 for a definition of genotype and phenotype and further discussion.) Heritability analyses estimate the relative contributions of differences in genetic and non-genetic factors to the total phenotypic variance in a population. Despite this observation, the link between family history and genetic factors in stuttering has been questioned in the past. For example, it was pointed out that political beliefs also run in families, but they are not hereditary. Inheritance patterns of stuttering in families were investigated in early work. Recent work, however, has analyzed biological samples in order to locate particular genes involved in stuttering. The findings have shifted the viewpoint heavily in favor of the position that genetics play a crucial role in the onset and, possibly, the course of stuttering although there is no consensus at present about what genes are involved.
4.2 HERITABILITY OF STUTTERING IN TWIN STUDIES
The logical first step toward identifying genetic factors in stuttering is to ascertain the extent to which it is heritable. Early work, mentioned in the introduction (section 4.1), did this by examining the pedigrees of people who stutter with respect to whether other members stuttered (Bryngelson & Rutherford, 1937). One problem with this method is that it relies on respondents’ memory about family members that they may not know well because of mobility in contemporary society. A second is that, as discussed below in section 4.5.3.3 and more fully in Chapter 13, the same caregivers report fewer family members who stuttered before their child started to stutter than after (Reilly et al., 2009). Twin modeling techniques do not suffer from these problems and have been used to determine the extent to which stuttering is heritable. This section provides a basic introduction to twin modeling techniques (see Rijsdijk & Sham, 2002, for further details) and to review the handful of recent studies that have estimated environmental influences in people who stutter.
A comparison is made between fraternal (dizygotic) and identical (monozygotic) twin pairs and whether one, both, or neither member stutters. These different types of twins provide vital information about heritability of characteristics. Identical, or monozygotic (MZ), twins result from a single ovum and, therefore, have the same genetic material, whereas fraternal or dizygotic (DZ) twins have separate ova and share, on average, 50% of their genes as would two siblings born at different times. DZ twins (and also MZ twins) have similar shared environments, particularly in early life.
Statistics that reflect degrees of overlap in characteristics shown by MZ and DZ twins is an important source of information about heritable and environmental influences. The three main ones encountered are concordance, covariance, and correlation. Concordance, as used in genetics, usually means the presence of the same characteristic (e.g., stutters) in both members of a pair of twins. Twins are concordant when both have or both lack a given characteristic. Technically, concordance is defined as the probability that a pair of individuals will both have a certain characteristic, given that one of the pair has the characteristic. Covariance is a measure of how much two variables change together (variance is a special case of covariance where the two variables are identical). For example, height and weight covary to a degree. Correlation in the area of genetics refers to the proportion of variance that two characteristics share due to genetic causes (hypothetical examples of variables that correlate to different degrees are discussed in section 4.2.1). The genetic correlation indicates how much of the genetic influence on two characteristics is common to both: if it is above zero, this suggests that the two characteristics are influenced by common genes.
4.2.1 THE LOGIC OF THE TWIN METHOD
The twin method compares the similarity of family members who share genes and environment to different extents. If pairs of individuals who share their environment resemble one another more than those who do not, this suggests an influence of shared environment. If pairs of individuals who share more of their genes are more similar to each other than pairs of individuals who share fewer of their genes, this suggests there is a genetic influence on those behaviors. Estimating environmental or genetic influences does not say anything about particular individuals, but it indicates the extent to which these influences apply to a sample. So, if a study was performed on anxiety in twins, the results would not tell a person the extent to which his or her genes/environment affect levels of anxiety; however, they do indicate the extent to which genes/environmental influences account for individual differences in anxiety scores.
The starting point in twin studies is to establish the correlation between pairs of scores for different types of twins (DZ separately from MZ) on the characteristics of interest. The three panels in Figure 4.1 show scatter plots for MZ twin pairs (twin 1 on the horizontal axis and twin 2 on the vertical axis) for three different characteristics that correlate to different degrees in the twins. Thus, each dot represents scores from a pair of twins. The correlations between twin 1 and twin 2 going left to right are 0.9, 0.5, and 0. The characteristics might be, respectively, height, which would be expected to correlate well; anxiety, which would correlate less well; and performance on games of chance that should not correlate at all. The variance of the twin pair scores is least when the scores correlate well and highest when the scores do not correlate.
The variance usually can be split into three parts using methods such as that described in the next section:
1. Additive genetics (A). These are the individual differences caused by genetic factors whose influences add up. This contrasts with nonadditive genetic variance in which the genetic factors interact (polygenic influences).
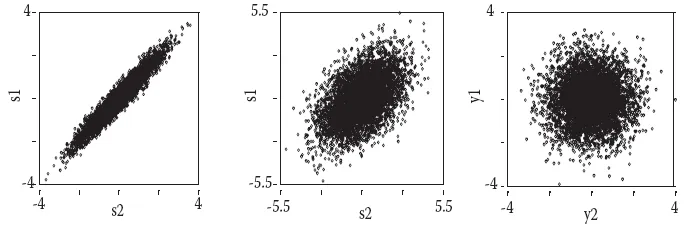
FIGURE 4.1 Shown are scatter plots for three characteristics that correlate 0.9, 0.5, and 0.
2. Common (shared) environment (C). This represents environmental factors responsible for the resemblance between family members (it is assumed that this is the same for the members of both DZ and MZ twin pairs).
3. Environment specific to each twin (nonshared environment, E, which also includes measurement error). E represents environmental influences that contribute to differences between family members.
4.2.2 STRUCTURAL EQUATION MODELS FOR ESTIMATING A, C, AND E
The conventional method for estimating A, C, and E involves structural equation modeling (SEM). SEM is a general technique as indicated by its use in CNS (central nervous system) studies (Chapter 5), in studies on affect (Chapter 9), and for risk modeling (Chapter 13). The basic background for understanding SEM modeling of twin data is described below, but SEM modeling is more complicated than described here. (See Levine, Petrides, Davis, Jackson, and Howell, 2005, for a next step toward an elementary introduction to the topic that uses illustrations from stuttering.)
Differences in genetic relatedness can be used to make predictions about the genetic and environmental factors that lie behind stuttering. Theoretical expectations for correlations of MZ and DZ twins for A, C, and E components are shown in Table 4.1. For A, MZ twins share all genetic material, so the correlation between their scores should be 1. DZ twins share 50% of their genetic material, so the correlations between their scores for A should be 0.5. Both MZ and DZ are exposed to the same common environment (C), so, in both cases, correlations should be 1. Unique environment, E, as its name implies, represents the component that is not shared between twins (either MZ or DZ), so the correlation is expected to be 0.
Figure 4.2 shows a simple path diagram that uses the expected correlations in Table 4.1 to construct an A, C, E model. This then can be used to estimate the contribution of the different components using a SEM. Path diagrams, like the one in Figure 4.2, are pictorial representations of an underlying system of mathematical
TABLE 4.1 Expected Correlations for A, C, and E (Labeled in the Row on the Left) for MZ (First Column) and DZ (Second Column) Twins
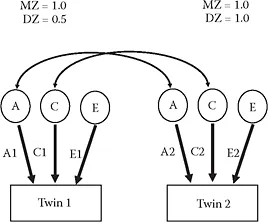
FIGURE 4.2 Path diagram used for modeling A, C, E effects using twin data. (See text for a detailed description of the structure of the model.)
equations. Observed indicators (i.e., the characteristic being studied) are designated by a box. Observations about the first member of each of the pairs of twins are shown by the boxes on the left and observations about the corresponding second member of each of the pairs of twins are shown by the boxes on the right of Figure 4.2. Three circles appear above each box (labeled A, C, and E). The circles indicate that these are latent variables, which means they are not directly observable. Their values are implied by the covariances among the observed indicators and can be obtained after the model has been fitted to obtain A (additive genetics), C (common environment), and E (unique environment). When fitting models, it is not just important to get values for these variables, or parameters, but also to know how well the model fits. The parameter estimates are only sensible if the fit of the model to the data is good.
The latent variables in Figure 4.2 are connected by two curved lines with arrows at each end at the top of the diagram: (1) for A of twin 1 with A of twin 2 and (2) for C of twin 1 with C of twin 2. The arrowheads at both ends indicate that these are nondirectional. The expected correlation structure for both MZ and DZ twin pairs from Table 4.1 for the nondirectional relationship between (1) the As and (2) the Cs are indicated at the left and right, respectively. No relationship is indicated between the Es (as mentioned earlier, unique means not shared, thus correlations would be expected to be zero). These are theoretical expectations and they can be set before model fit and are not adjusted during model fitting. Consequently, they are referred to as fixed parameters. The rest of the parameters are adjusted to fit the model to the data (free parameters) during model fitting.
A second set of connections links the latent variable with the observations. These are the lines from each of the A, C, and E circles with arrows that point to the boxes indicating observations either to twin 1 or to twin 2. Each line signifies that the latent variables directly influence observations on each member of a twin pair. Over...
Table of contents
- LANGUAGE AND SPEECH DISORDERS BOOK SERIES
- Contents
- Preface
- Section I General Aspects of Developmental Stuttering
- Section II Factors Related to Developmental Stuttering Based on Experimental Studies
- Section III Theoretical Frameworks on Developmental Stuttering
- Section IV Practical Issues in Developmental Stuttering
- References
- Author Index
- Subject Index
Frequently asked questions
Yes, you can cancel anytime from the Subscription tab in your account settings on the Perlego website. Your subscription will stay active until the end of your current billing period. Learn how to cancel your subscription
No, books cannot be downloaded as external files, such as PDFs, for use outside of Perlego. However, you can download books within the Perlego app for offline reading on mobile or tablet. Learn how to download books offline
Perlego offers two plans: Essential and Complete
- Essential is ideal for learners and professionals who enjoy exploring a wide range of subjects. Access the Essential Library with 800,000+ trusted titles and best-sellers across business, personal growth, and the humanities. Includes unlimited reading time and Standard Read Aloud voice.
- Complete: Perfect for advanced learners and researchers needing full, unrestricted access. Unlock 1.4M+ books across hundreds of subjects, including academic and specialized titles. The Complete Plan also includes advanced features like Premium Read Aloud and Research Assistant.
We are an online textbook subscription service, where you can get access to an entire online library for less than the price of a single book per month. With over 1 million books across 990+ topics, we’ve got you covered! Learn about our mission
Look out for the read-aloud symbol on your next book to see if you can listen to it. The read-aloud tool reads text aloud for you, highlighting the text as it is being read. You can pause it, speed it up and slow it down. Learn more about Read Aloud
Yes! You can use the Perlego app on both iOS and Android devices to read anytime, anywhere — even offline. Perfect for commutes or when you’re on the go.
Please note we cannot support devices running on iOS 13 and Android 7 or earlier. Learn more about using the app
Please note we cannot support devices running on iOS 13 and Android 7 or earlier. Learn more about using the app
Yes, you can access Recovery from Stuttering by Peter Howell in PDF and/or ePUB format, as well as other popular books in Psychology & Cognitive Neuroscience & Neuropsychology. We have over one million books available in our catalogue for you to explore.