![]()
1
Control Systems Engineering
LEARNING OBJECTIVES
• To comprehend the fundamentals of electrical and electronics engineering
• To identify electrical terminologies
• To know the concepts of basic electronics
• To understand the basic concepts of control systems
• To recognize the types of controllers
1.1 Introduction
In this text, we present a comprehensive analysis of the current trends and technologies in control systems for the textile industry. Our approach is to dissect the important components of an integrated control system and then to determine if and how the components are converging to provide manageable and reliable systems throughout the chain from fiber to the ultimate customer. Although the implementation of advanced process control strategies is not foreseen in immediate future, it is apparent that the textile industry is slowly moving toward modular machines and systems. The dedicated systems still prevalent today are gradually being replaced by standard units, distributed automation concepts, and an increasing connectivity of the production floor with planning and scheduling systems.
1.2 Electrical Terminology
Charge is the most fundamental concept in electricity. It derives from the properties of elementary particles, with protons (and hence the nucleus of the atom) being positively charged, and electrons negatively charged. The unit of charge is the coulomb (C). The charge on the electron is 1.60219 × 10⁻¹⁹ C (i.e., one coulomb corresponds to about 6 × 10¹⁸ electrons). An important quantity in electrochemistry, known as Faraday’s Constant (or often just the Faraday) and given the symbol F, is the charge associated with one mole of a singly charged species such as H+ or Cl−. As one mole contains Avogadro’s number (6.0228 × 10²³) molecules, the Faraday is 6.0228 × 1023 × 1.60219 × 10−19 C, or 96485 C.
Current is the rate of flow of charge along a conductor (note that this charge may be electrons flowing in a metal or ions flowing in solution). One Amp (A) corresponds to a flow of 1 coulomb per second.
Potential is an indication of the potential energy of a unit charge at a particular point in a circuit. Strictly it is the potential energy involved in moving a charge of one coulomb to that point from infinity; therefore, it is quite difficult to measure.
Potential difference or voltage is the difference in potential between two points. There is one volt between two points if one Joule is required to move one coulomb from one point to the other. As with current, potential may apply to charge in the form of ions or in the form of electrons. However, for a valid potential difference, the charge must be the same at each location.
Resistance is the tendency of a conductor to obstruct the flow of current. Ohm’s Law states that the voltage (V) across a resistor is proportional to the current (I) flowing through it:
where R is the resistance, which is measured in units of Ohm. Like many laws, this is an approximation, and many conductors, including the metal-solution interface, have a nonlinear resistance.
Capacitance is the tendency of a device incorporating two conductors that are insulated from each other to absorb charge when the voltage between the conductors is changed. The charge, Q, is given by
where:
C is the capacitance (which is measured in Farads)
∆V is the change in voltage
It is noted that the symbol C is used conventionally both for capacitance and coulombs.
We can see the effect of trying to pass a current through a capacitor by remembering that current is charge per unit time. Hence:
where:
∆t is the incremental change in time
dV is the instantaneous change in voltage
dt is the instantaneous change in time
1.2.1 Inductance
Due to the interrelation between electric currents and magnetic fields, there is a tendency for current to flow at a constant rate through a conductor. In most real conductors, this tendency is counteracted by the resistance of the conductor, although in superconductors, which have no resistance, current will flow essentially forever unless the current is caused to change by the application of a voltage. The inductance (L) of a particular conductor is a measure of the voltage needed to cause the current to change at a particular rate.
where dI/dt is the instantaneous rate of current change. The units of inductance are Henrys. One Henry will give a rate of change of current of one A/s with one voltage (V) applied across it.
1.2.2 Impedance
Impedance is a general term used to describe the relationship between the voltage across a component (or essentially any device capable of allowing at least some current to flow) and the current flowing through that device. It is normally used in relation to alternating current with a sine waveform, but it is perfectly valid to refer to the impedance at zero frequency (i.e., direct current).
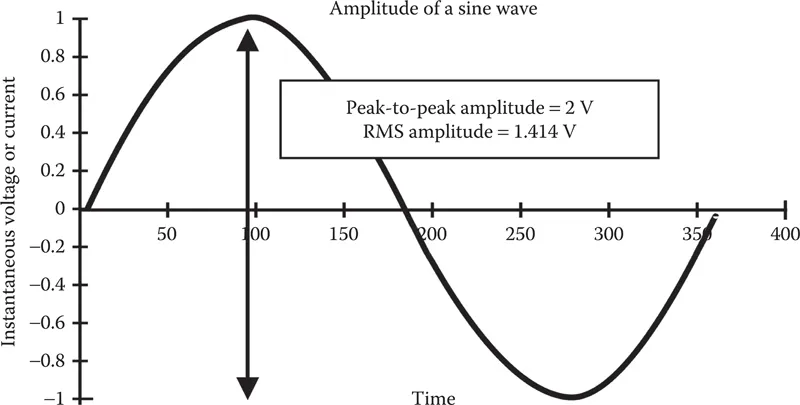
1.2.3 Amplitude
For fluctuating voltage or current, the amplitude describes how large the fluctuations are. There are several ways of describing the amplitude (Figure 1.1):
• The root mean square (RMS) value: As implied in the name, this is obtained by taking the square root of the average value of the square of the voltage or current. When applied specifically to ac signals, the dc level (the average value of the voltage or current) may be subtracted before calculating the RMS value. The RMS value indicates the power present in the signal.
• The peak-to-peak value: This is simply the maximum value minus the minimum value. While it is a simple value to measure, it has the disadvantage that signals may have the same peak-to-peak voltage, yet deliver very different powers into a load.
• The power spectrum: The two previous measurements only give an overall indication of the power present in the signal, with no indication of how that power is distributed in terms of the frequency. The power spectrum presents the power present in the signal at each frequency (known as the power spectral density, with units of V2/Hz or I2/Hz).
• Note that both the RMS and the peak-to-peak amplitudes will depend on the frequency response of the measurement system, with a wider bandwidth giving a larger measured amplitude.
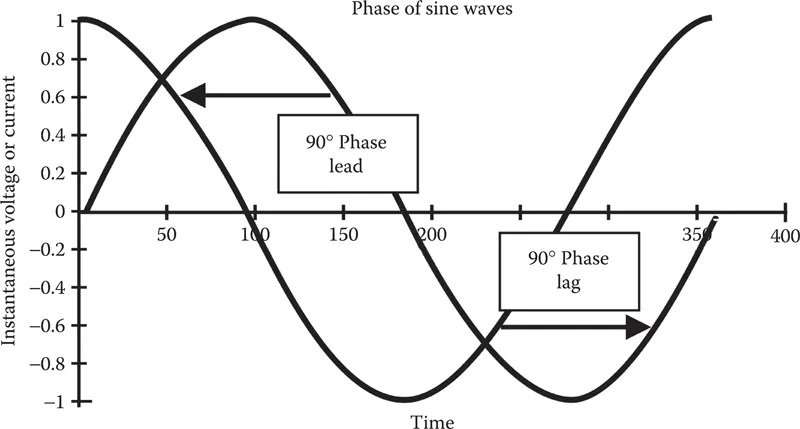
1.2.4 Phase
The phase of a sine wave describes its position in time relative to a reference sine wave of the same frequency. The units used are radians or degrees, and relate to the general equation for a sine wave:
FIGURE 1.1
Amplitude.
where:
is the phase
is the angular frequency
t is the time
a is the amplitude
The phase of one signal relative to another may be described as “leading,” if the voltage for the signal being considered reaches a specific point in the cycle before the reference sine wave. Conversely, the signal is said to “lag” the reference signal if it reaches a given point in the cycle after the reference signal. Note that whether a lead or lag is observed depends on which signal is taken as the reference (see the Figure 1.2). It is also valid to describe a 90° lag as a 270° lead. When referring to impedance measurements, the current is taken as the reference signal; so the phase of the impedance at a particular frequency will be the phase of the voltage with respect to the current (Figure 1.2).
FIGURE 1.2
Phases of sine waves....