Statistical Inference via Data Science: A ModernDive into R and the Tidyverse
eBook - ePub

Statistical Inference via Data Science: A ModernDive into R and the Tidyverse

  1. 430 pages
  2. English
  3. ePUB (mobile friendly)
  4. Available on iOS & Android
eBook - ePub

Statistical Inference via Data Science: A ModernDive into R and the Tidyverse

Book details
Book preview
Table of contents
Citations

About This Book

Statistical Inference via Data Science: A ModernDive into R and the Tidyverse provides a pathway for learning about statistical inference using data science tools widely used in industry, academia, and government. It introduces the tidyverse suite of R packages, including the ggplot2 package for data visualization, and the dplyr package for data wrangling. After equipping readers with just enough of these data science tools to perform effective exploratory data analyses, the book covers traditional introductory statistics topics like confidence intervals, hypothesis testing, and multiple regression modeling, while focusing on visualization throughout.

Features:
? Assumes minimal prerequisites, notably, no prior calculus nor coding experience
? Motivates theory using real-world data, including all domestic flights leaving New York City in 2013, the Gapminder project, and the data journalism website, FiveThirtyEight.com
? Centers on simulation-based approaches to statistical inference rather than mathematical formulas
? Uses the infer package for "tidy" and transparent statistical inference to construct confidence intervals and conduct hypothesis tests via the bootstrap and permutation methods
? Provides all code and output embedded directly in the text; also available in the online version at moderndive.com

This book is intended for individuals who would like to simultaneously start developing their data science toolbox and start learning about the inferential and modeling tools used in much of modern-day research. The book can be used in methods and data science courses and first courses in statistics, at both the undergraduate and graduate levels.

Frequently asked questions

Simply head over to the account section in settings and click on “Cancel Subscription” - it’s as simple as that. After you cancel, your membership will stay active for the remainder of the time you’ve paid for. Learn more here.
At the moment all of our mobile-responsive ePub books are available to download via the app. Most of our PDFs are also available to download and we're working on making the final remaining ones downloadable now. Learn more here.
Both plans give you full access to the library and all of Perlego’s features. The only differences are the price and subscription period: With the annual plan you’ll save around 30% compared to 12 months on the monthly plan.
We are an online textbook subscription service, where you can get access to an entire online library for less than the price of a single book per month. With over 1 million books across 1000+ topics, we’ve got you covered! Learn more here.
Look out for the read-aloud symbol on your next book to see if you can listen to it. The read-aloud tool reads text aloud for you, highlighting the text as it is being read. You can pause it, speed it up and slow it down. Learn more here.
Yes, you can access Statistical Inference via Data Science: A ModernDive into R and the Tidyverse by Chester Ismay, Albert Y. Kim in PDF and/or ePUB format, as well as other popular books in Mathematics & Probability & Statistics. We have over one million books available in our catalogue for you to explore.

Information

Year
2019
ISBN
9781000763560
Edition
1

1

Getting Started with Data in R

Before we can start exploring data in R, there are some key concepts to understand first:
1. What are R and RStudio?
2. How do I code in R?
3. What are R packages?
We’ll introduce these concepts in the upcoming Sections 1.1-1.3. If you are already somewhat familiar with these concepts, feel free to skip to Section 1.4 where we’ll introduce our first dataset: all domestic flights departing one of the three main New York City (NYC) airports in 2013. This is a dataset we will explore in depth for much of the rest of this book.

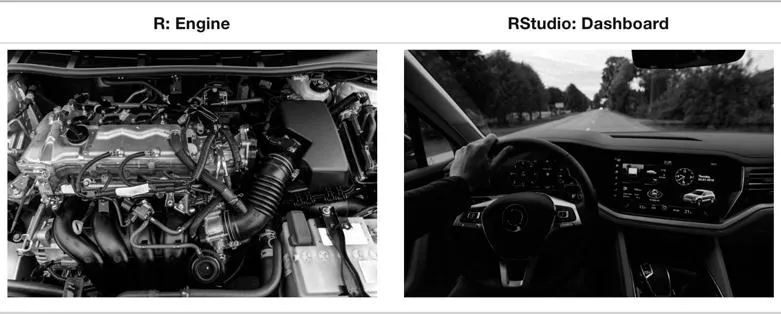
1.1 What are R and RStudio?

Throughout this book, we will assume that you are using R via RStudio. First time users often confuse the two. At its simplest, R is like a car’s engine while RStudio is like a car’s dashboard as illustrated in Figure 1.1.
Image
FIGURE 1.1: Analogy of difference between R and RStudio.
More precisely, R is a programming language that runs computations, while RStudio is an integrated development environment (IDE) that provides an interface by adding many convenient features and tools. So just as the way of having access to a speedometer, rearview mirrors, and a navigation system makes driving much easier, using RStudio’s interface makes using R much easier as well.

1.1.1 Installing R and RStudio
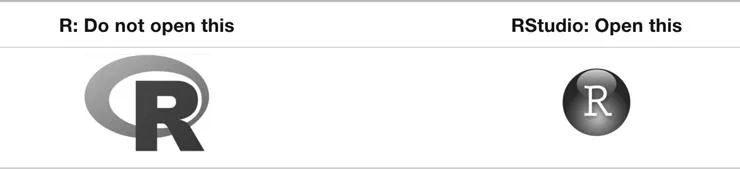
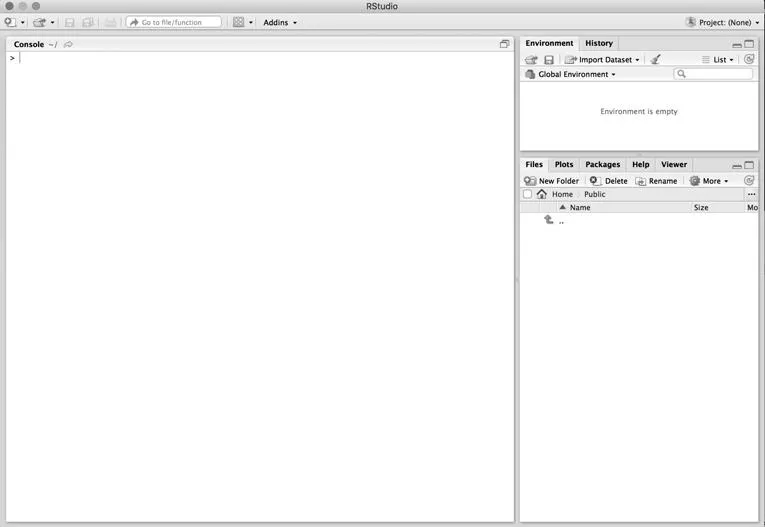
Note about RStudio Server or RStudio Cloud: If your instructor has provided you with a link and access to RStudio Server or RStudio Cloud, then you can skip this section. We do recommend after a few months of working on RStudio Server/Cloud that you return to these instructions to install this software on your own computer though.
You will first need to download and install both R and RStudio (Desktop version) on your computer. It is important that you install R first and then install RStudio.
1. You must do this first: Download and install R by going to https://cloud.r-project.org/.
• If you are a Windows user: Click on “Download R for Windows”, then click on “base”, then click on the Download link.
• If you are macOS user: Click on “Download R for (Mac) OS X”, then under “Latest release:” click on R-X.X.X.pkg, where R-X.X.X is the version number. For example, the latest version of R as of November 25, 2019 was R-3.6.1.
• If you are a Linux user: Click on “Download R for Linux” and choose your distribution for more information on installing R for your setup.
2. You must do this second: Download and install RStudio at https://www.rstudio.com/products/rstudio/download/.
• Scroll down to “Installers for Supported Platforms” near the bottom of the page.
• Click on the download link corresponding to your computer’s operating system.

1.1.2 Using R via RStudio

Recall our car analogy from earlier. Much as we don’t drive a car by interacting directly with the engine but rather by interacting with elements on the car’s dashboard, we won’t be using R directly but rather we will use RStudio’s interface. After you install R and RStudio on your computer, you’ll have two new programs (also called applications) you can open. We’ll always work in RStudio and not in the R application. Figure 1.2 shows what icon you should be clicking on your computer.
Image
FIGURE 1.2: Icons of R versus RStudio on your computer.
After you open RStudio, you should see something similar to Figure 1.3. (Note that slight differences might exist if the RStudio interface is updated after 2019 to not be this by default.)
Image
FIGURE 1.3: RStudio interface to R.
Note the three panes which are three panels dividing the screen: the console pane, the files pane, and the environment pane. Over the course of this chapter, you’ll come to learn what purpose each of these panes serves.

1.2 How do I code in R?

Now that you’re set up with R and RStudio, you are probably asking yourself, “OK. Now how do I use R?”. The first thing to note is that unlike other statistical software programs like Excel, SPSS, or Minitab that provide point-and-click1 interfaces, R is an interpreted language2. This means you have to type in commands written in R code. In other words, you have to code/program in R. Note that we’ll use the terms “coding” and “programming” interchangeably in this book.
While it is not required to be a seasoned coder/computer programmer to use R, there is still a set of basic programming concepts that new R users need to understand. Consequently, while this book is not a book on programming, you will still learn just enough of these basic programming concepts needed to explore and analyze data effectively.

1.2.1 Basic programming concepts and terminology

We now introduce some basic programming concepts and terminology. Instead of asking you to memorize all these concepts and terminology right now, we’ll guide you so that you’ll “learn by doing.” To help you learn, we will always use a different font to distinguish regular text from computer_code. The best way to master these topics is, in our opinions, through deliberate practice3 with R and lots of repetition.
• Basics:
– Console pane: where you enter in commands.
– Running code: the act of telling R to perform an act by giving it commands in the console.
– Objects: where values are saved in R. We’ll show you how to assign values to objects and how to display the contents of objects.
– Data types: integers, doubles/numerics, logicals, and characters. Integers are values like -1, 0, 2, 4092. Doubles or numerics are a larger set of values containing both the integers but also fractions and decimal values like -24.932 and 0.8. Logicals are either TRUE or FALSE while characters are text such as “cabbage”, “Hamilton”, “The Wire is the greatest TV show ever”, and “This ramen is delicious.” Note that characters are often denoted with the quotation marks around them.
• Vectors: a series of values. These are created using the c() function, where c() stands for “combine” or “concatenate.” For example, c(6, 11, 13, 31, 90, 92) creates a six element series of positive integer values.
• Factors: categorical data are commonly represented in R as factors. Categorical data can also be represented as strings. We’ll study thi...

Table of contents

  1. Cover
  2. Half Title
  3. Series Page
  4. Title Page
  5. Copyright Page
  6. Dedication
  7. Table of Contents
  8. Foreword
  9. Preface
  10. About the authors
  11. 1 Getting Started with Data in R
  12. I Data Science with tidyverse
  13. II Data Modeling with moderndive
  14. III Statistical Inference with infer
  15. IV Conclusion
  16. Appendix A Statistical Background
  17. Appendix B Versions of R Packages Used
  18. Bibliography
  19. Index