- 196 pages
- English
- ePUB (mobile friendly)
- Available on iOS & Android
eBook - ePub
Design for Climate Change
About this book
Ford architects, contractors, engineers and specialists in the field, this book uses real-world evidence from a Technology Strategy Board-funded research project to develop a set of tools for architects and other building designers to meet a growing need to anticipate future climate change. Built on in his seminal future climate change report for the TSB, identifies three broad categories of climate change impacts on building design – comfort and energy performance, construction, and managing water.
Tools to learn more effectively

Saving Books

Keyword Search

Annotating Text

Listen to it instead
Information
Topic
ArchitectureSubtopic
Architecture General1
Agenda for a Changing Climate
Warming of the climate system is unequivocal, as is now evident from observations of increases in global average air and ocean temperatures, widespread melting of snow and ice and rising global average sea level.
Fourth Assessment Report from the UN Intergovernmental Panel on Climate Change (IPCC), 2007
There is an overwhelming scientific consensus that:
- the climate is changing
- these changes are very likely due to increased global greenhouse-gas concentrations resulting from human activity, particularly from the use of fossil fuels
- these changes will continue if we remain on our current path, with increasingly severe consequences for all life on the planet
- there is considerable momentum in the climate system; even if greenhouse-gas concentrations were to be stabilised, warming and sea-level rise would continue for decades.
Given the scale of observed change, considerable scientific effort has been made to understand the global climate system and the reasons behind the warming, and to predict how the climate might change in future. In 1979, the first World Climate Conference, organised by the World Meteorological Organisation (WMO), expressed concern that “continued expansion of man’s activities on earth may cause significant extended regional and even global changes of climate”, and called for global cooperation to explore future changes and their impact on human development.
As a result, in 1988 the Intergovernmental Panel on Climate Change (IPCC) was established by the United Nations Environment Programme and the WMO to assess the risk of human-induced climate change, its potential impacts and the options for adaptation and mitigation.
From 1990, the IPCC has issued a series of reports based on peer-reviewed and published research, which have tended to grow in detail, evidence and confidence. The latest is the 2007 Fourth Assessment Report, quoted above, which reported findings based on 23 sophisticated climate models from 11 countries around the globe, including two from the UK’s Met Office Hadley Centre, one of the world’s leading centres for climate-science research. The report included the graph below, which indicates the potential extent of global warming.
The graph plots temperatures through the 21st century for three greenhouse-gas-emission scenarios, as well as a plot showing what would happen if greenhouse-gas concentrations were held at year-2000 values. The three future scenarios were selected from six marker scenarios used in the Fourth Assessment Report, to which the bars on the right-hand side of the graph refer. The bars show the “likely” spread of values in 2100 for each marker scenario, indicating the range of uncertainty associated with the modelling results. The scenarios and the issue of uncertainty are described in more detail in Chapter 2.
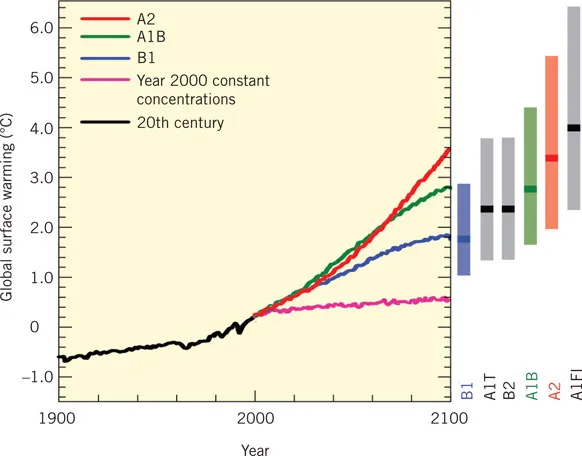
1.1 The graph above is taken from the IPCC’s Fourth Assessment Report on Climate Change (2007). It shows the global averages of surface warming (relative to 1980–99) for three different greenhouse-gas emissions scenarios, as well as a theoretical scenario where emissions are held at year-2000 values. To the side of the graph, the bars indicate the best estimate (solid line) and likely range of temperature change by 2090–99 for six emissions scenarios. Emissions scenarios are described in more detail in the next chapter.
Source: Climate Change 2007: Synthesis Report. Contribution of Working Groups I, II and III to the Fourth Assessment Report of the Intergovernmental Panel on Climate Change, figure 3.2 (left panel). IPCC, Geneva, Switzerland
The graph highlights two points:
- the climate has already changed measurably since the baseline of 1990. We are not starting from zero
- up to 2050, there is little real difference between the scenarios; however, beyond the 2050s, they diverge, demonstrating the paramount importance of reducing emissions.
It is worth noting that while climate models vary in their predictions of the speed and magnitude of warming, there are no credible models that show global temperatures remaining steady or decreasing.
The report also sets out the potential impact of rising temperatures on the planet’s ecosystems, human settlements and way of life, summarised in the table overleaf from the UK Treasury’s 2006 Stern Review. There is a high level of confidence that a rise of more than 2°C would result in very significant impacts for all aspects of life, particularly coastal flooding and species extinction. Coastal flooding on this scale is not about the loss of a few distant islands or remote wetlands – their trading origins mean that most of the world’s great commercial centres are in coastal locations. By 2050, the UN estimates that 70% of the world’s population will live in cities, which means that it will be heavily concentrated in delta areas.
The potential impacts of climate change have set the agenda for successive United Nations Climate Change conferences, which have led to a general acceptance that warming must be limited to a 2°C rise if we are to avoid catastrophic impacts. This is the stark criterion on which ongoing attempts to reach international agreement to limit global emissions are based.
The issues are thus clear, urgent and interlinked. We need both to reduce the emissions that drive climate change (mitigation) and to deal with the physical effects of inevitable changes that are already under way (adaptation). The more successful we are at the former, the less will be the need for the latter.
For the construction industry, this means pursuing the now-familiar low-energy low-carbon design agenda that is increasingly embedded in legislation, but also recognising that we need to design differently in order to adapt to changes such as higher summer temperatures and to cope with more extreme events.
The UK government has led the way internationally in developing policies to tackle the dangers of climate change. In 2008, the Climate Change Act was passed, setting the world’s first long-term legally binding targets for emissions reduction (80% by 2050) and establishing the independent Committee on Climate Change. Its remit is to advise the government on setting and meeting carbon budgets and monitoring its progress, and also informing and monitoring progress on adaptation through the Adaptation Sub-Committee.

1.2 This table is taken from the Stern Review, produced for the UK Treasury (2006). It shows a range of disastrous impacts if global temperatures rise by more than 2°C. Source: The Stern Review Report © Crown copyright 2006, The Economics of Climate Change: The Stern Review © Cambridge University Press 2007
The government’s National Adaptation Programme is led by the Department for Environment, Food and Rural Affairs (DEFRA). Its first step was to produce a UK Climate Change Risk Assessment (CCRA) in January 2012, to be updated every five years. The key risks identified for buildings were:
- damage due to flooding and coastal erosion
- overheating
- increasing impact from the urban heat island effect (see Chapter 2)
- subsidence.
Other risks directly relevant to the built environment included:
- water supply shortage
- increased water demand for energy generation
- higher energy demand for cooling
- flood risk to energy infrastructure
- heat damage/disruption to energy infrastructure.
Government departments have also been required to draw up Departmental Adaptation Plans, setting out key climate-change risks and priorities. These were published in March 2010, and updated in May 2011.
It is interesting to note an apparent disconnection between our mitigation policies and our approach to adaptation. The Committee on Climate Change has explored a number of ways of achieving our mitigation goal, set, as described above, in order to limit warming to below 2°C. To give an indication of the magnitude of the action required, a typical reduction pathway would be to cut emissions by 4% year-on-year, starting in 2016. This scenario is plotted overleaf, against the Low (B1), Medium (A1B) and High (A1FI) emissions scenarios used by the Met Office Hadley Centre for UK climate projections.
The graph shows all too clearly that the three scenarios used as the basis for adaptation take a more pessimistic, or perhaps realistic, view of future emissions reduction. Even the Low emissions scenario represents a failure of our global mitigation goal and, by implication, of our attempt to avert catastrophic change.
It is all too easy for the challenge of adaptation to become an intriguing academic puzzle – for designers to become mesmerised by the interaction between projection data and theoretical building models without stepping back to consider the implications for the social and economic context within which their buildings will exist. The teams involved in the Design for Future Climate programme can be forgiven for not attempting to address this wider context, but policy makers must think more broadly. The construction industry may be able to deliver buildings that would in theory perform beautifully in temperatures even 4°C above current levels – but what will the world around them be like? What will be the human and economic consequences of this level of change in locations that are not blessed with our benign climate? And how will this affect “normal” life in the UK?
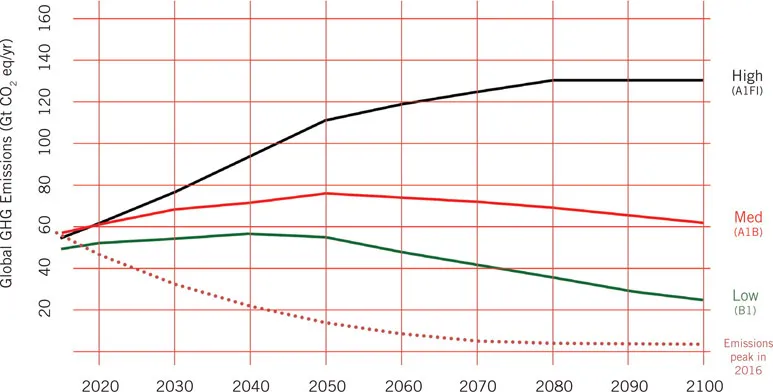
1.3 One possible scenario for avoiding catastrophic climate change is for global emissions to peak in 2016 and continue to decline by 4% each year after that. This graph shows how this compares to the high, medium and low emissions scenarios used to inform climate change adaptation strategies.
Climate Change in the UK
Trends observed in the UK reflect global patterns. The Central England Temperature (CET) record – the oldest-established instrumental record of temperature in the world – shows that after a period of relative stability for most of the 20th century, our annual average temperature has risen by about 1°C since the 1970s.2
Observed trends are projected to continue and can be summarised as follows:
- warmer, wetter winters
- hotter, drier summers
- rising sea levels
- increased extreme weather events.
Weather events that are currently regarded as extreme are useful illustrations of what is projected to be normal in future. For example, the exceptionally hot summer of 2003 is likely to become the norm by the second half of this century.
Design Agenda
The impact of climate change is particularly pertinent to the construction industry, simply because buildings last a long time. Our existing built environment, and every aspect of how we live our lives, has evolved in response to a particular climate. Now that climate is changing, and may soon be significantly different. We face a real challenge in converting and upgrading our urban fabric to function in a climate for which it was not designed.
This book follows the same structure as the Design for Future Climate report, published in 2010 to provide the background to inform teams embarking on their projects, in which climate-change impacts for the built environment were split into three broad categories:
- comfort and energy performance – warmer winters may reduce the need for heating, but it will be difficult to keep cool in summer without increasing energy use and carbon emissions
- construction – resistance to extreme conditions, detailing and the behaviour of materials
- managing water – both too much (flooding) and too little (shortages and soil movement).
Over recent years, the construction industry has responded to the mitigation agenda but it has not yet got to grips with adaptation. There must now be a recognition that some changes to our climate cannot be avoided, and that these changes will have a significant impact on how our buildings perform, where they should be built and how they are constructed. It should also be remembered that change is likely to be ongoing – the rate and extent being dependent on the success of global mitigation strategies – resulting in more significant change in the second half of the century.
We need to rethink the way we design, construct, upgrade and occupy buildings to accommodate this, developing approaches that are based not on past experience but on calculated projections of future climate.
Context
Climate change is a “moving target”, and the challenges will differ according to location and building type. There are no universal solutions. Adaptation strategies must be thoroughly grounded in a building’s context, which means not only projected changes in the climate but changes to geography, urban fabric, energy, construction and society too.
Location
The regional variations in climate that already exist across the UK (and which are sometimes ignored by building legislation and policy) are projected to increase somewhat. This could potentially exaggerate the differences between appropriate climatic design responses across the country, so evident in our vernacular tradition.
Achieving comfortable internal temperatures in the future climate in the north of the country will be easier than in the warmer urban south-east, for example. T...
Table of contents
- Cover
- Title
- Copyright
- Contents
- Foreword
- Preface
- 1 Agenda for a Changing Climate
- 2 Understanding Future Climate
- 3 Designing for Thermal Comfort: Comfort & Overheating
- 4 Designing for Thermal Comfort: Controlling Heat Gains
- 5 Designing for Thermal Comfort: Cooling Strategies
- 6 Construction
- 7 Water
- 8 Clients, Control and Costs
- 9 What Now?
- APPENDICES
- Notes
- Index
Frequently asked questions
Yes, you can cancel anytime from the Subscription tab in your account settings on the Perlego website. Your subscription will stay active until the end of your current billing period. Learn how to cancel your subscription
No, books cannot be downloaded as external files, such as PDFs, for use outside of Perlego. However, you can download books within the Perlego app for offline reading on mobile or tablet. Learn how to download books offline
Perlego offers two plans: Essential and Complete
- Essential is ideal for learners and professionals who enjoy exploring a wide range of subjects. Access the Essential Library with 800,000+ trusted titles and best-sellers across business, personal growth, and the humanities. Includes unlimited reading time and Standard Read Aloud voice.
- Complete: Perfect for advanced learners and researchers needing full, unrestricted access. Unlock 1.4M+ books across hundreds of subjects, including academic and specialized titles. The Complete Plan also includes advanced features like Premium Read Aloud and Research Assistant.
We are an online textbook subscription service, where you can get access to an entire online library for less than the price of a single book per month. With over 1 million books across 990+ topics, we’ve got you covered! Learn about our mission
Look out for the read-aloud symbol on your next book to see if you can listen to it. The read-aloud tool reads text aloud for you, highlighting the text as it is being read. You can pause it, speed it up and slow it down. Learn more about Read Aloud
Yes! You can use the Perlego app on both iOS and Android devices to read anytime, anywhere — even offline. Perfect for commutes or when you’re on the go.
Please note we cannot support devices running on iOS 13 and Android 7 or earlier. Learn more about using the app
Please note we cannot support devices running on iOS 13 and Android 7 or earlier. Learn more about using the app
Yes, you can access Design for Climate Change by Katie Puckett,William Gethering in PDF and/or ePUB format, as well as other popular books in Architecture & Architecture General. We have over one million books available in our catalogue for you to explore.