![]() PART I:
PART I:
INTRODUCTION![]()
Chapter 1
East Asian Economic Performance in Retrospect
M. Raquib Zaman
INTRODUCTION
Since the 1950s economists and development experts have been trying to decipher what factors, actions, and/or policies, are behind spectacular performance in economic development by some countries, and lack of progress by others. The less developed countries (LDCs) were, as a whole, more or less at a similar stage of economic growth in the 1950s and 1960s. Yet at the advent of the twenty-first century, some of the LDCs, notably East Asian economies, joined the ranks of the newly industrialized countries (NICs), whereas others have made little progress in economic development.
It is interesting to note that over the past four decades the East Asian countries, as well as some of the Latin American countries, pursued similar policies of import substitution and export promotion at various stages of their economic growth with varied results. The idea that economic development can be facilitated by promoting import substitution and protecting the nascent domestic industries through facilitating fiscal and monetary policies was so prevalent among the development experts and policymakers that at one time or another this was tried out by Taiwan (Eckes, 1993; Chu, 1994; Birdsall et al., 1995; Ranis, 1995), Korea (Alam, 1989; Aggarwal and Agmon, 1990; Dollar, 1990; Birdsall et al., 1995; Ranis, 1995), Singapore, Malaysia, and the Latin American countries (Aggarwal and Agmon, 1990; Turner, 1992; Nelson, 1994). Since import substitution policies did not achieve the results hoped for, the LDCs had to find an alternative strategy. The East Asian countries (EACs) decided to follow the Japanese model of export-led economic growth.
The Japanese model of economic growth called for targeting industries with export potential for preferential access to capital and for protecting them from competition in the domestic market (Wolf, 1998). This model worked for the EACs until the 1997–1998 financial crises, when the shortcomings of the strategy became quite apparent (Zaman, 1998a, 2000).
This short chapter tries to demonstrate the distinctive characteristics of the policy measures that the EACs adopted successfully to generate sustainable economic growth in their countries since the 1960s. It explains why it will be difficult to replicate the performance record of the EACs by the LDCs of today, given the present skepticism about globalization and trade liberalization, and because some of the special circumstances and institutions that played crucial roles in economic transformation of the EACs are no longer available to the newcomers. Added to these are the emergence of the information technology revolution, which enables countries to access information and know-how at a rapid pace, and the rise of a tech-savvy workforce in a number of relatively better-off LDCs that can attract foreign multinational corporations (MNCs) to relocate production and service facilities in their midst.
THE EAST ASIAN “MIRACLE”
The term East Asian Miracle was popularized by a World Bank (1993) policy research report of the same title to dramatize the progress the EACs had made in economic growth and development in a mere three decades. Taiwan was the first country among the EACs to follow the Japanese economic model for growth. It embarked on economic development by imposing land reforms that boosted investment in agriculture, raised productivity, and ultimately released human resources for deployment in a manufacturing sector that was geared toward exports. Simultaneously, the nation invested heavily in education, first focusing on primary education, then promoting vocational training and skills, and following up with graduate-level science and technology fields. It also pursued policies and undertook measures to reduce fertility. The presence of a strong government, albeit not democratic, and clarity in economic policies, along with trade liberalization, proved to be the other important factors that propelled the country to achieve spectacular economic growth (Ranis, 1995; Birdsall et al., 1995).
Taiwan was followed by South Korea, and then the other EACs, all pursuing essentially a similar path of economic development. The public policies in these countries were geared toward adapting to the changing needs of time and to weathering external economic shocks. In their drive toward modernization, the EACs followed policies of import substitution, trade liberalization, and export promotion at appropriate times (Krueger, 1997), unlike many LDCs in Asia, Africa, and Latin America.
The role of business organizations, that is, business networks, in advancing economic growth in the EACs has not received the recognition it deserves. It can be argued that the networks, such as the keiretsus in Japan, chaebols in Korea, guanxi in China, Chinese huran gongsi and jituan gongsi, the overseas Chinese networks in Indonesia, Singapore, Malaysia, and Thailand, and the overseas Indian networks in southeast Asia, were the driving force behind entrepreneurial risk-taking that propelled economic growth in the region (Richter, 1999; Weidenbaum and Hughes, 1996). These business networks “have played an important role in spurring, maintaining, and enhancing entrepreneurial activities” (Zahra et al., 1999, p. 55). The absence of such networks possibly has made a difference in the pace of economic development in the non-EAC regions.
In 1960 Argentina, Chile, and Mexico had higher per capita GNP than Hong Kong, South Korea, Taiwan, and Singapore (except Mexico). Yet by 2001 these EACs far out stripped their Latin American counterparts. China, Indonesia, Malaysia, and Thailand first embarked on trade liberalization policies in the 1980s. Yet Malaysia has already surpassed Brazil in terms of economic growth. If we examine the purchasing power parity (PPP) data, we find that EACs as a whole has been developing at a faster rate than the other selected countries.
Perhaps better indicators of economic development are given by the rates of growth in total productivity and in fixed capital stock. South Korea and Taiwan generated higher rates of growth of output per worker, during practically all the three time periods of 1960–1973, 1973–1984, and 1984–1994, than the Latin American, South Asian, and OECD countries. Only during the period of 1960–1973 was the performance of Latin American workers somewhat respectable. Not only did South Korea and Taiwan attain positive and higher growth rates in total factor productivity, but they achieved these through higher rates of utilization of physical capital and education per worker. Even South Asia had higher rates of growth in total productivity in 1973–1984 and 1984–1994 than both the Latin American and OECD countries. In the 1950s and 1960s some of the Latin American countries had better performance records than the EACs.
The reasons for the hapless performance of the Latin American economies beginning in the 1970s have been discussed widely (see, for example, Sachs, 1990; Turner, 1992; Solanet, 1994), and were summarized by Zaman (1998b) as follows:
(1) pursuance of inward-oriented trade policies that encouraged production of poor quality import substitution goods, with;
(2) a heavy reliance on foreign debt;
(3) over-regulation of trade and investment policies;
(4) lack of discipline in monetary and fiscal policies that resulted in high levels of inflation; and
(5) lack of adequate political and social reforms.
It is only in the 1980s that some of the countries embarked on economic reforms.
An exception is Venezuela, which is in the same doldrums as the oil-exporting Middle Eastern countries. It seems
that resource-poor countries grew two to three times faster than the resource-rich countries between 1960 and 1990…. The resource-rich countries began to lag only after the 1970s … after oil wealth started to pour in. (The Economist, May 24, 2003, p. 78)
According to The Economist, this can be explained by two factors. First, “an oil bonanza causes a sudden rush of foreign earnings,” which drives up the value of the nation’s currency. This in turn leads to the second factor, which is decreased competitiveness of domestically produced goods at home and abroad. Eventually, growth suffers as agriculture and domestic manufacturing fade.
Over a period of four decades, beginning with 1950–1960, the EACs generated higher rates of growth in capital stock than did several countries of Latin America, South Asia, and the OECD. This was possible because of the development measures and policies (described earlier) that the EACs followed in a timely fashion. Growth in capital stock was facilitated by the rush of foreign direct investments, FDI, in the region. Looking at the FDI inward stock of selected countries since 1980 at five-year intervals, China, Hong Kong, and Singapore experienced massive build ups of FDI inward stock in a mere two decades, compared to Argentina, Chile, and India. China’s performance is unprecedented. From a mere $6.25 billion worth of FDI stock in 1980, it ballooned to more than $447 billion by 2002. Tiny Hong Kong’s FDI inward stock had been larger than that of China until 2001. Hong Kong has been the gateway to the Chinese market for decades. It served as the transshipment center for Chinese trade with the West when it was a British colony. The mainland has now come of age, as far as FDI is concerned. The city-state of Singapore thrived by pursuing trade liberalization policies that attracted a massive inflow of FDI, first in import substitution industries, followed by export oriented activities, and finally financial services industries. It has also been a transshipment center for ship-to-ship transfers of legal and illegal products.
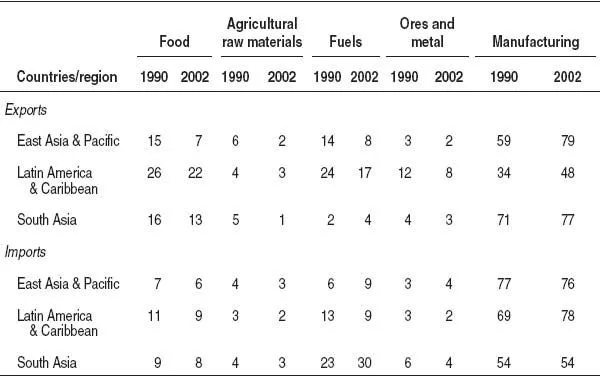
An examination of the data on merchandise exports and imports (see Table 1.1) further corroborates the fact that the EACs made better progress in industrialization than the other regions. It should be noted that the percentage share of manufacturing exports of South Asia, though it looks similar to that of EACs, is not that significant once we look at the total exports from the regions. Total exports of EACs in 1990 and 2002 were $156 billion and $606 billion, respectively. The comparable figures for South Asia were $28 billion and $71 billion; and that of Latin America and the Caribbean were $143 billion and $348 billion (World Bank, 2002, Table 4.5).
Perhaps data on the shares of the regions in world exports of manufactures, and value-added manufacturing would shed further light on the superior performance of the EACs over other regions. Most of the shares of the world exports of manufactures that the developed countries lost between 1980 and 1997 were picked up by the EACs. When comes to the share in world value-added manufacturing we again find that the lion’s share of the developing countries’ gain came from the EACs. Latin America actually lost some ground between 1980 and 1997.
TABLE 1.1. Structure of merchandise exports and imports of EACs and selected regions (percentage of totals).
Source: World Bank, 2004, Tables 4.5 and 4.6.
Note: Total exports and imports of South Asia are miniscule compared to the other two regions.
THE FINANCIAL CRISES OF 1997 AND 1998 AND THE AFTERMATH
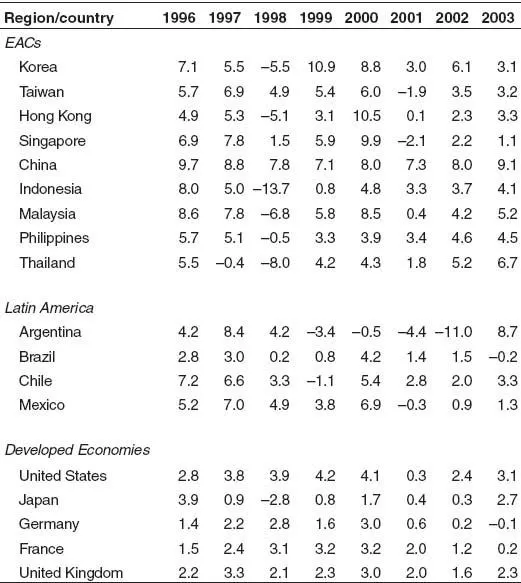
The crisis in the financial markets in Asia was ushered in by the collapse of the Thai currency, the baht, in July 1997. The contagion spread rapidly through East and Southeast Asia and the global financial markets. Table 1.2 presents data on the percentage change in the real gross domestic product (GDP) of EACs and selected countries between 1996 and 2003. The 1996 data show the position of the countries before the advent of the crisis. The growth rates slowed down in 1997 in Korea, China, Indonesia, Malaysia, and the Philippines, and became negative for Thailand. By 1998 all the economies of the region felt the contagion, and except for Taiwan, China, and Singapore, all experienced negative growth in their real GDPs.
TABLE 1.2. Percentage change in real GDP of selected countries.
Source: International Monetary Fund, 1998–2003.
The EACs were on the road to recovery beginning in 1999, with some slow down in 2001 as a result of the technology bubble burst and the terrorism crisis in the United States. Argentina’s financial and political crises manifested themselves in the declines in its economy since 1999.
It is instructive to dwell on the causes of the Asian financial market’s collapse in 1997–1998. The World Bank, in a sequel to The East Asian Miracle, published East Asia: The Road to Recovery (1998) to explain what went wrong with “the Asian miracle.” It is as follows:
Rapid growth, urbanization, and industrialization were spawning new and difficult development problems prior to the crisis. These were building in three dimensions. First, rapid growth, in the absence of sophisticated financial and capital markets and with a large government presence, left the corporate financial sectors unusually reliant on financing long-term investments with short-term debt capital…. Second, economic growth was undermining the traditional protection mechanisms for the unemployed, the sick, and the elderly. East Asia relied on high personal savings and family ties to provide security for its elderly. It came to rely on growth itself to provide an even more buoyant labor market. The forces of growth, with their demands for an increasingly mobile labor force, migration, and wider scope for personal consumption, were putting strains on traditional ways of solving social problems. In the transition countries of China and Vietnam, the old commune and state enterprise system of welfare was under analogous strains with the spread of markets. In the wealthiest countries, lifetime employment guarantees in the corporate sector were proving increasingly out of tune with the modern economy’s needs for rapid change and flexibility. Third, a weakness of a different kind resulted from the exploitation of natural resources, particularly forests. Southeast Asian growth was fueled, in part, by over-logging, intensive exploitation of fisheries, and wasteful agricultural practices … some estimates are that Malaysia’s growth in gross domestic product (GDP) would have been approximately 20 percent less if adequate allowance had been made for resource depletion. (p...