![]()
1
Climate change matters
ǣToday, global climate change is a fact. The climate has changed visibly, tangibly, measurably. An additional increase in average temperatures is not only possible, but very probable, while human intervention in the natural climate system plays an important, if not decisive role.
BRUNO PORRO, CHIEF RISK OFFICER, SWISS REINSURANCE, 2002.1
Climate change is a major concern in relation to the minerals sector and sustainable development. It is, potentially, one of the greatest of all threats to the environment, to biodiversity and ultimately to our quality of life.
FACING THE FUTURE, MINING MINERALS AND SUSTAINABLE DEVELOPMENT AUSTRALIA, 2002.2
We, the human species, are confronting a planetary emergency – a threat to the survival of our civilization that is gathering ominous and destructive potential even as we gather here. But there is hopeful news as well: we have the ability to solve this crisis and avoid the worst – though not all – of its consequences, if we act boldly, decisively and quickly.
AL GORE, NOBEL PEACE PRIZE LECTURE, 10 DECEMBER 2007.3
Climate is critical to the world as we know it. The landscape, and the plants and animals in it, are all determined to a large extent by climate acting over long intervals of time. Over geological time, climate has helped to shape mountains, build up the soil, determine the nature of the rivers, and build flood plains and deltas. At least until the advent of irrigation and industrialisation, climate determined food supplies and where human beings could live.
Today, with modern technology, humans can live in places where it was impossible before. This is achieved by the provision of buildings and complex infrastructure tuned to the existing climate, such as urban and rural water supplies, drainage, bridges, roads and other communications. These involve huge investments of time and money. Trade, particularly of food and fibre for manufactured goods, has also been strongly influenced by climate. Roads, buildings and towns are designed taking local climate into consideration. Design rules, both formal and informal, zoning and safety standards are developed to cope not just with average climate but also with climatic extremes such as floods and droughts. If the climate changes, human society must adapt by changing its designs, rules and infrastructure – often at great expense, especially for retrofitting existing infrastructure.
In broad terms, ‘climate’ is the typical range of weather, including its variability, experienced at a particular place. It is often expressed statistically, in terms of averages over a season or number of years, of temperature or rainfall and sometimes in terms of other variables such as wind, humidity, and so on. Variability is an important factor. ‘Climate variability’ is variability in the average weather behaviour at a particular location from one year to another, or one decade to another. Changes in the behaviour of the weather over longer time scales, such as one century to another, are usually referred to as ‘climate change’.
Conventionally, 30-year intervals have been used for calculating averages and estimating weather variability. However, natural climate varies on time scales from year-to-year, through decade-to-decade to longer-term fluctuations over centuries and millennia.
Extreme weather events are part of climate. Their impact is reflected in the design of human settlements and activities (such as farming) so as to be able to survive floods, droughts, severe storms and other weather-related stresses or catastrophes. Because climate can vary from decade to decade, reliable averages of the frequency and magnitudes of extreme events require weather observations over longer periods than the conventional 30 years. Engineers design infrastructure (buildings, bridges, dams, drains, etc.) to cope with extreme weather events that occur on average only once in every 50, 100 or 1000 years. The more serious the consequence of design failure under extreme weather conditions, the longer the time interval considered, for example for a large dam as opposed to a street drain.
Turning up the heat
Climate has changed greatly over geological timescales, as we shall see in Chapter 2. But what is of immediate concern is that climate has shown an almost unprecedented rapid global warming trend in the last few decades.
Since the start of reliable observations in the nineteenth century, scientists from weather services and research laboratories in many countries have examined local, regional and global average surface air and water temperatures, on land, from ships and more recently from orbiting satellites.
The World Meteorological Organization, which coordinates weather services around the globe, has declared that 2005 and 1998 were the two warmest years on record, since reliable weather records began in 1861, and just warmer than 2003. The decade of 1998–2007 was the warmest on record. Twelve of the last 13 years (1995–2007), with the exception of 1996, rank amongst the 12 warmest years since reliable records began in 1850. Since the start of the twentieth century the global average surface temperature has risen by 0.74 ± 0.18°C, and the linear warming trend over the last 50 years, around 0.13 ± 0.3°C per decade, is nearly twice that for the last 100 years.4
Note that when scientists give such estimates they usually include a range of uncertainty, which in the former case above is ±0.18°C. Thus the increase could be as low as 0.56°C or as high as 0.92°C. In this case the uncertainties allow for possible inaccuracies in individual measurements, and how well the average from the limited number of individual measurement stations represents the average from all locations.
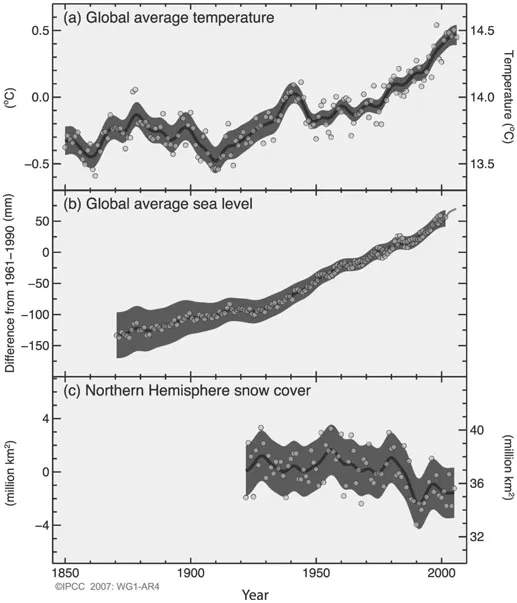
Indirect evidence from tree rings, ice cores, boreholes, and other climate-sensitive indicators (see Chapter 2) indicates that, despite a lesser warm interval round 1000 AD (the so-called ‘Medieval Warm Period’) the warmth of the last half century is unusual in at least the previous 1300 years. Moreover, the last time the polar regions were significantly warmer than the present for an extended period (some 125 000 years ago), reductions in polar ice volume led to global sea levels 4 to 6 m above the present. Variations of the Earth’s surface temperature since 1850, along with global average sea level from 1870 and northern hemisphere snow cover since the 1920s, are shown in Figure 1.
Based on such observations, the Intergovernmental Panel on Climate Change (IPCC) in 2007 concluded that ‘warming of the climate system is unequivocal, as is now evident from observations of increases in global average air and ocean temperatures, widespread melting of snow and ice, and rising global average sea level’.
Figure 1: Observed changes in (a) global average surface temperature, (b) global average sea level and (c) northern hemisphere snow cover, from the start of good measurements. This is Figure SPM-3 from the IPCC 2007 Working Group I report (used with permission from IPCC).
Three things are notable about these IPCC conclusions. First, it shows that a warming of at least 0.56°C almost certainly occurred. Second, the most likely value of 0.74°C, while it may appear to be small, is already a sizeable fraction of the global warming of about 5°C that took place from the last glaciation around 20 000 years ago to the present interglacial period (which commenced some 10 000 years ago). Prehistoric global warming led to a complete transformation of the Earth’s surface, with the disappearance of massive ice sheets, and continent-wide changes in vegetation cover, regional extinctions and a sea-level rise of about 120 metres.
Most importantly, the average rate of warming at the end of the last glaciation was about 5°C in some 10 000 years, or 0.05°C per century, while the observed rate of warming in the last 50 years is 1.3°C per century and the estimated rate over the next 100 years could be more than 5°C per century, which is 100 times as fast as during the last deglaciation. Such rapid rates of warming would make adaptation by natural and human systems extremely difficult or impossible (see Chapters 2 and 7).
Some critics have questioned the IPCC’s estimated warming figures on the following main grounds. First, there are questions of uncertainties due to changes in instruments. Instrumental changes include changes in the housing of thermometers (‘meteorological screens’) which affect the ventilation and radiant heat reaching the thermometers, and changes in ships’ observations from measuring the temperature of water obtained from buckets dropped over the side of ships to measurements of the temperature of sea water pumped in to cool the ships’ engines. These changes are well recognised by scientists and have been allowed for. They contribute to the estimate of uncertainty.
Second, there are concerns that estimates are biased by observations from stations where local warming is caused by the growth of cities (an effect known as ‘urban heat islands’).
The heat island effect is due to the heat absorbed or given out by buildings and roads (especially at night). However, this effect works both ways on observed trends. In many large cities, observing sites, which were originally near city centres (and thus subject to warming as the cities grew) were replaced by observing sites at airports outside the cities. This led to a temporary observed cooling until urbanisation reached as far as the airports. Observations from sites affected by urban heat islands have, in general, been either corrected for this effect or excluded from the averages. A recent study of temperature trends on windy nights versus all nights shows similar warming trends, even though wind disperses locally generated heat and greatly reduces any heat island effect.5
One of the strengths of the surface observations is that those from land surface meteorological stations tend to agree well with nearby ship observations, despite different sources of possible errors. Average sea surface temperatures show similar trends to land-based observations for the same regions. Airborne observations from balloon-borne radio-sondes at near-ground levels also tend to support the land-based observational trends.
Another issue often raised is the apparent difference between the trends in temperature found in surface observations and those from satellites, which began in 1979. The satellite observations are not straightforward, as corrections are needed for instrumental changes and satellite orbital variations. Moreover, they record average air temperatures over the lowest several kilometres of the atmosphere (including the lower stratosphere at mid- to high-latitudes) rather than surface air temperatures, so they do not measure the same thing as surface observations. Recent corrections to the satellite and radiosonde estimates to take account of these problems have removed the discrepancies and confirm that surface and tropospheric (lower atmospheric) warming are occurring.
All the above criticisms of the temperature records have been addressed explicitly in successive IPCC reports and can now be dismissed.6 Legitimate estimates of uncertainty are given in the IPCC assessments.
Supporting evidence for recent global warming comes from many different regions and types of phenomena. For example, there is now ample evidence of retreat of alpine and continental glaciers in response to the twentieth century warming (there are exceptions in some mid- to high-latitude coastal locations where snowfall has increased).7 This retreat has accelerated in the last couple of decades as the rate of global warming has increased. Figure 2 shows dramatic evidence of this for the Trient Glacier in the Valais region of southern Switzerland. The surviving glacier is in the upper centre, extending right to the...