![]()
1
Introduction: Aviation and Climate Change in Context
Stefan Gössling and Paul Upham
The age of aviation
Looking back in time, the history of aviation covers more than 220 years, at least if the brothers Montgolfier’s hot-air balloon is considered as the first functioning flying machine (see Grant, 2007). The balloon made its first manned flight in 1783, even though the brothers Montgolfier preferred not to be on board themselves. There then followed 120 years of various attempts to build manoeuvrable flight machines, until the Wright brothers achieved powered aeroplane flight in 1903. Within two and a half decades of the event, Charles Lindberg embarked on the first transatlantic flight (in 1927), and the speed of the development of aircraft accelerated: in the mid-1930s, Douglas DC-3s came into service, the first all-metal aircraft, which could carry 21 passengers. Another 15 years later, jet aircraft went into regular service with the de Havilland Comet and, somewhat later, the Boeing 707 and Douglas DC-8, commencing the age of mass passenger transportation (Grant, 2007).
As with individual motorized transportation more generally, the use of aircraft has developed at an accelerating speed reflected in transport statistics. For instance, the United Nations World Tourism Organization (UNWTO, 2008a) reports that the number of international tourist arrivals – comprising both leisure and business travellers using all means of transport – was 25 million in 1950, increasing to about 900 million in 2007. Annual growth in international tourist arrivals is now more than twice the total number of international arrivals up to 1950, that is more than 50 million per year. While the share of international tourists arriving by air in 1950 is unknown, though it can be assumed to be low, it is now more than 40 per cent. In the near future, tourism is believed to expand rapidly: UNWTO (2008b) estimates that international tourist arrivals will double to 1.6 billion in the period 2005–2020, that is in less than 15 years. An increasing share of these will arrive by air (UNWTO-UNEP-WMO, 2008).
Transport statistics more generally reveal the same developments and trends. Even though global statistics are difficult to obtain, those available for example for the United States show how rapidly aviation gained importance: revenue passenger ton-miles increased from about 3.2 billion to 84.1 billion in the period 1954–2007, and in 2007, US flights alone carried 663 million passengers (Bureau of Transportation Statistics, 2008). In the same year, 831 million passengers were carried worldwide on international air trips and 1249 million on domestic trips (IATA, 2008a).1 US flights thus account for almost one third of global passenger transport. In the context of this book, it may also be interesting to look at the distribution of premium class (first class and business class) versus economy class travellers. Statistics provided by the Internationa Air Transport Association (IATA, 2008a) show that in 2007, there were 73.4 million domestic and 69.8 million international premium class passengers travellers, compared to 1.2 billion domestic and 760.7 million international travellers, representing a ratio of 1:16 (domestic) and 1:11 (international) of premium to economy class passengers. This is of importance as premium class travellers can be assumed to consume roughly twice as much space as business class travellers, thus substantially increasing fuel use.
While the number of air travellers has increased, the number of aircraft manufacturers has declined, with two major players (Airbus in Europe and Boeing in the United States) as well as three smaller manufacturers (Bombardier in Canada, Embraer in Brazil and Tupolev in Russia) dominating the markets for civil aircraft. China will soon re-enter the ranks of aircraft manufacturing countries, primarily to cater to its own domestic market, which is anticipated to develop its current fleet of about 1000 aircraft to 3400 by 2026, according to the news magazine Time (2007). China’s demand will thus add considerably to the global demand for civil commercial aircraft. Boeing presumes that 29,400 aircraft will be delivered worldwide in the period 2008–2027, despite a challenging economic situation: ‘Air transport is in a highly dynamic period. Challenges include a slowing world economy, high oil prices, and in some markets, slowing traffic growth’ (Boeing, 2008, p1). By 2027, 35,800 aircraft are anticipated to be in service, representing growth of 88 per cent from 19,000 aircraft in 2007. Passenger numbers will grow by 4.0 per cent per year and distances travelled at 5.0 per cent per year (measured in revenue passenger kilometres, RPKs) over the coming 20 years; while air cargo (measured in revenue tonne kilometres, RTKs) will grow by 5.8 per cent, a development fuelled in particular by the fastest growing economies, that is the Asia-Pacific region (Boeing, 2008). Note that Airbus (2007) projects even higher growth rates, with an annual 4.9 per cent increase in passenger numbers up to 2026, but an identical estimate for air cargo growth (5.8 per cent per year).
It becomes clear from these figures that aviation has seen considerable growth in the past 50 years. It also seems evident that emissions from aviation will grow even more rapidly in the near future, though at a slower pace than transport volumes. For instance, Boeing (2008) suggests that aeroplanes will carry about 40 per cent more traffic in 2027 (measured RPK) than the average aircraft today.
Aviation and climate change
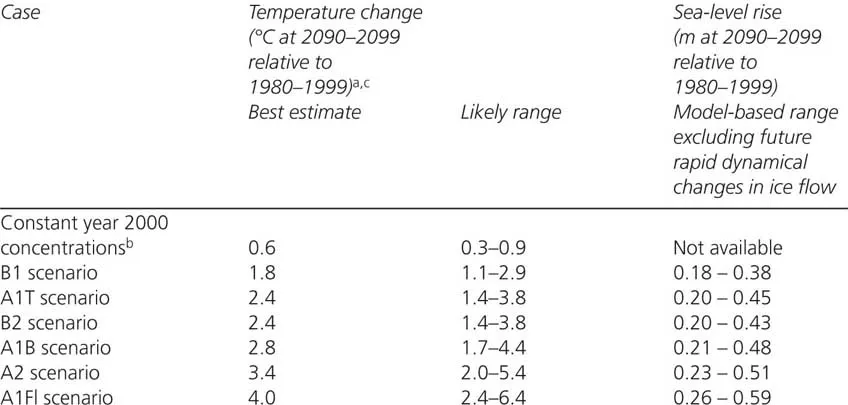
As the Intergovernmental Panel on Climate Change (IPCC, 2007) has stressed in its synthesis report, warming of the climate system is now ‘unequivocal’ (IPCC, 2007, p30). Temperature increases are widespread over the globe, with 11 of the 12 years in the period 1995–2006 ranking among the warmest since the beginning of the recording of global surface temperatures in 1850. In the past 100 years, temperatures are assumed to have increased by 0.74°C on global average. The change of the climate system already has a wide range of consequences for biological and socio-economic systems, all of which are anticipated to become significantly more relevant for humanity in the medium- to long-term future (Stern, 2006, see also Schneider, 2008). For instance, global and regional impacts of even a 2°C rise include the destruction of the vast majority of current coral reefs, 3 billion people experiencing water stress and changes in global cereal production that could expose as many as 220 million more people to the risk of hunger (Warren, 2006). At a global average of +3°C temperature increase, few ecosystems would be able to adapt and, for example, there would be much larger losses in global cereal production than predicted at 2°C, potentially exposing a further 400 million people to hunger (Warren, 2006). Note that the range of projections by the IPCC (2007, p8) includes a far greater range of temperature changes (Table 1.1). According to scenarios B1 to A1FI, temperature changes in the period 2090–2099, relative to 1980–1999, will vary between 1.8 and 4.0°C. Concomitant sea-level rise will be in between 18 and 59cm, not considering future rapid changes in ice flow. The latter is an important omission and serves to reminds one that the IPCC is always conservative in its statements. It would be wise to keep in mind the admonition of Hansen et al (2008):
If humanity wishes to preserve a planet similar to that on which civilization developed and to which life on Earth is adapted, paleoclimate evidence and ongoing climate change suggest that CO2 will need to be reduced from its current 385ppm to at most 350ppm… If the present overshoot of this target CO2 is not brief, there is a possibility of seeding irreversible catastrophic effects.
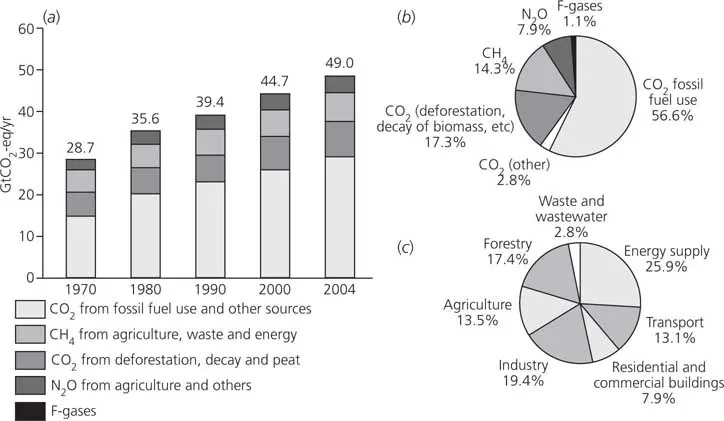
Table 1.1 shows the increase and distribution of emissions of greenhouse gases (GHGs) from various sources. As shown, emissions have vastly increased since 1970, from less than 29GtCO2-eq to 49GtCO2-eq in 2004. Out of these, emissions from burning fossil fuels account for 56.6 per cent (Figure 1.1(b)). More than 17 per cent are caused by deforestation, the remainder largely being attributable to emissions of methane (CH4) and nitrous oxide (N2O). Finally, if looked at by sector, transport seems to account for only a minor share of global emissions of greenhouse gases, that is slightly more than 13 per cent (Figure 1.1(c)). It has thus often been argued that the transport sector is responsible for only a small share of emissions, and aviation for an even smaller one within the transport sector, that is typically about 2 per cent of global anthropogenic emissions of CO2. IATA (2008c) reports that in 2004, aviation’s emissions of CO2 were 705 million tonnes, including commercial, military and general aviation. Statistically, this represents 2.54 per cent of global emissions of CO2from fossil fuel use (56.6 per cent of 49GtCO2-eq in 2004). IATA (2008c) also states that if other greenhouse gases are included, aviation accounts for 3 per cent of the total humanmade contribution to climate change (see also Chapter 2, this volume).
Table 1.1 Projected global average surface warming and sea-level rise at the end of the 21st century
Source: IPCC, 2007
Figure 1.1 (a) Global annual emissions of anthropogenic GHGs from 1970 to 2004 (b) Share of different anthropogenic GHGs in total emissions in 2004 in terms of carbon dioxide equivalents (CO2-eq) (c) Share of different sectors in total anthropogenic GHG emissions in 2004 in terms of CO2-eq
Source: IPCC, 2007
While a contribution of 3 per cent to global anthropogenic greenhouse gas emissions may still seem negligible, the percentage should be considered with regard to (i) growth rates in the aviation sector, (ii) the reduction in greenhouse gas emissions demanded by the IPCC (2007; see also Parry et al. 2008), as well as the fact that (iii) aviation is still an activity largely confined to industrialized countries with high per capita emissions levels. For instance, aviation contributes to a considerably larger share of emissions in industrialized countries (e.g. Gössling and Hall, 2008), and it is estimated that only 2–3 per cent of the global population participate in international air travel on an annual basis (Peeters et al. 2006). Furthermore, emissions should be seen in the light of their relative importance: there is no other human activity pushing individual emission levels as fast and as high as air travel. For instance, a return trip from Europe to Thailand, currently a popular holiday destination for Swedes, will typically cause emissions of about 2tCO2 per traveller, that is about half the global average per capita emissions of 4tCO2. Given the fact that average emissions of 4tCO2 per capita per year need to be considered too high (see IPCC, 2007), it seems evident that air travel has a huge potential to contribute to unsustainable development.
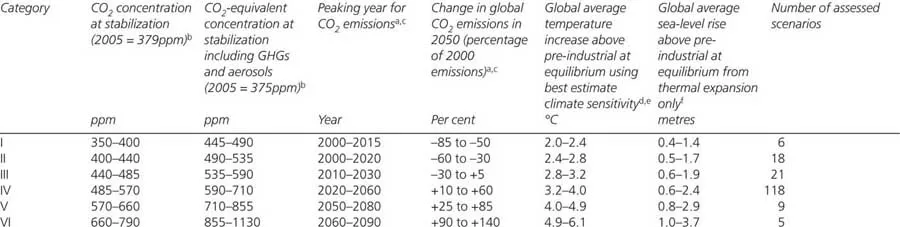
The IPCC (2007) has made it very clear that substantial emissions reductions are necessary in the near future and some climate scientists (see Hansen et al. 2008) are increasingly referring to the need for steep reductions. For instance, Parry et al (2008) argue that stabilization of atmospheric GHGs should be at 400–470ppm CO2-eq, for which global emissions need to peak in 2015 and decline by 3 per cent per year in the following period, with the authors pointing out that ‘Limiting impacts to acceptable levels by mid-century and beyond would require an 80 per cent cut in global emissions by 2050’ (Parry et al. 2008, p69). Note that this goes beyond emissions reduction goals in even the most ambitious industrialized countries. Table 1.2 illustrates this for a range of greenhouse gas stabilization scenarios, indicating that only the most stringent ones are likely to lead to an average global warming not exceeding 2°C by 2100, that is the European Union’s policy goal, or what is considered to avoid dangerous interference with the climate system.
Table 1.2 Characteristics, stabilization scenarios and resulting long-term equilibrium global average temperature
Source: IPCC, 2007
In this context it is interesting to note that although the European Commission has proposed that the EU pursues – within the framework of international negotiations – the objective of a 30 per cent reduction in greenhouse gas emissions by developed countries by 2020 (compared to 1990 levels), it also sees an expanded role for the Clean Development Mechanism (CDM) in this process (EC, 2008, p11). Rather than deal with the substantial domestic political difficulties of taking responsibility for emissions – difficulties compounded through years of ignoring the problem – there is thus a growing likelihood that Commissioners will opt to make significant use of the CDM. This will enable the EU to simultaneously retain a relatively stringent climate tar...