eBook - ePub
Capturing Carbon and Conserving Biodiversity
The Market Approach
- 368 pages
- English
- ePUB (mobile friendly)
- Available on iOS & Android
eBook - ePub
Capturing Carbon and Conserving Biodiversity
The Market Approach
About this book
For decades conservation has been based on the donor-driven principle. It hasn't worked. For centuries, environmental pollution or degradation has been addressed by the same attitude: the 'Polluter Pays' principle. That hasn't worked either. The cycle has to stop. But while everyone talks about using a market-driven approach, few know how to do it. Faced with the situation on the ground what do you do? What is happening? How can you engage a system so that it is self-sustaining and the people self-motivated? This study explores how the growing market in carbon can help to conserve carbon-based life forms. It discusses how reducing global warming and saving biodiversity can both be achieved with the right market conditions. The contributors include conservation biologists, ecologists, biologists, economists, lawyers, community and tribal specialists, financial specialists, market makers, environment specialists, climatologists, resource managers, atmospheric scientists, project developers and corporate fund managers.
Trusted by 375,005 students
Access to over 1.5 million titles for a fair monthly price.
Study more efficiently using our study tools.
Information
Subtopic
Economic TheoryIndex
EconomicsPart 1
CARBON AND CLIMATE CHANGE
Chapter 1
Forests, carbon and global climate

YADVINDER MALHI, PATRICK MEIR AND SANDRA BROWN
Introduction
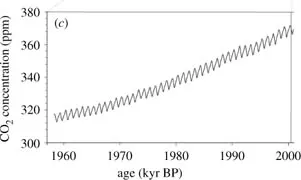
In recent centuries, human activities have fundamentally altered many of the Earth's biogeochemical cycles. Among the first recognized and most prominent of these changes has been the modification of the global carbon cycle. The dramatic release of carbon trapped by both prehistoric ecosystems (i.e. fossil fuels) and modern-day vegetation has led to a 31% increase in concentrations of atmospheric carbon dioxide (CO2) from a preindustrial concentration of ca. 280 ppm to 368 ppm in 2000. This concentration has certainly not been exceeded during the past 420 000 years, and probably not during the past 20 million years. Moreover, the rate of increase in CO2 concentration during the past century is at least an order of magnitude greater than the world has seen for the last 20 kyr (Prentice et al. 2001). CO2 is the most important of the greenhouse gases that are increasingly trapping solar heat and warming the global climate. In addition to climatic warming, this extra CO2 may have a number of effects on terrestrial ecosystems, from increasing plant growth rates and biomass to modifying ecosystem composition by altering the competitive balance between species.
The focus of this chapter will be on the role of forests and forest management in this global carbon cycle. In their pre-agricultural state, forests are estimated to have covered ca. 57 million km2 (Goldewijk 2001), and contained ca. 500 PgC (1 PgC = 1 GtC = 1015 g of carbon) in living biomass and a further 700 PgC in soil organic matter (Figure 1.3), in total holding more than twice the total amount of carbon in the preindustrial atmosphere and circulating 10% of atmospheric CO2 back and forth into the biosphere every year through gross photosynthesis. A reduction of global forest cover has accompanied human history since the dawn of the agricultural revolution 8000 years ago, but by 1700 only ca. 7% of global forest area had been lost (Ramankutty & Foley 1999; Goldewijk 2001). The intensity and scale of human alteration of the biosphere has accelerated since the industrial revolution, and by 1990 ca. 20–30% of original forest area had been lost. This loss of forest cover has contributed 45% of the increase in atmospheric CO2 observed since 1850. In recent decades, carbon emissions from fossil fuels have surpassed those from deforestation, but land-use change still contributes ca. 25% of current human-induced carbon emissions. However, just as the loss of forests has significantly contributed to the atmospheric ‘carbon disruption’, so good forest management, the prevention of deforestation, and the regrowth of forests have a significant potential to lessen the carbon disruption.
In this review we place into context the role of forests in the global carbon cycle and climate change. In the first section we examine the preindustrial ‘natural’ carbon cycle, both in recent millennia and during the ice ages. We then review the anthropogenic ‘carbon disruption’, examining the influences of both land-use change and fossil-fuel combustion on the global carbon cycle, and the causes, magnitudes and uncertainties of the natural ‘carbon sinks’ in both oceans and terrestrial ecosystems. Finally, we peer into the future and examine the influence that forest management and protection can play on the climate of the 21st century.
The natural global carbon cycle
The global carbon cycle before the industrial carbon disruption
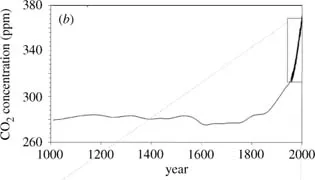
As our planet emerged from the last glacial maximum 11 000 years ago, the climate first warmed and became wetter, but subsequently underwent a slight cooling and aridification 8000 years before present (BP). Human populations and activities increased substantially during this epoch, the Holocene, but, until the Industrial Revolution, atmospheric CO2 concentration varied only a little, increasing overall from a post-glacial minimum of 260–285 ppm in the late 19th century (Figure 1.2).
The relative constancy in CO2 concentrations during the previous few millennia implies a rough constancy in the global carbon cycle. Figure 1.1 identifies the main global stocks of carbon and the principal fluxes among them for the natural or ‘pre-carbon disruption’ era. There are four main carbon stores, which are, in decreasing order of size, the geological, the oceanic, the terrestrial and the atmospheric reservoirs. Although the smallest component, it is changes in the atmospheric carbon store that ultimately provide the direct link between changes in the global carbon cycle and changes in climate.
The thick arrows in Figure 1.1 denote the most important fluxes from the point of view of the contemporary CO2 balance of the atmosphere: they represent gross primary production (i.e. absorption of carbon from the atmosphere through photosynthesis) and respiration (release of carbon to the atmosphere) by the land surface, and physical sea–air exchange. Under ‘natural’ conditions these two main carbon transfer pathways between the atmosphere and the land or the oceans are in approximate balance over an annual cycle, and represent a total exchange of 120 PgC yr−1, of which the larger share (120 PgC yr−1) is taken by the land (Prentice et al. 2001). This annual exchange is more than 25 times the total amount of carbon annually released into the atmosphere through human activities. Forests are responsible for about half of total terrestrial photosynthesis, and hence for ca. 60 PgC yr−1. The processes governing this exchange are biological and physical, and hence are responsive to climate. Consequently, a fractional net change in them resulting from small changes in climate (e.g. temperature) could match the magnitude of the human-linked emissions causing them.
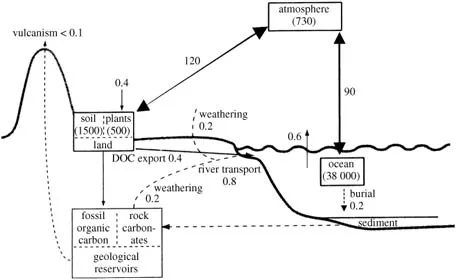
Figure 1.1. Main components of the carbon cycle. The thick arrows represent gross primary production and respiration by the biosphere and physical sea–air exchange. The thin arrows denote natural fluxes which are important over longer time-scales. Dashed lines represent fluxes of carbon as calcium carbonate. The units for all fluxes are PgC yr−1; the units for all compartments are PgC.
A number of additional fluxes also occur as part of the natural carbon cycle (Figure 1.1). The transfer by plants of 0.4 PgC yr−1 of inert carbon from the atmosphere to the soil is balanced by the outflow of dissolved organic carbon (DOC) through rivers to the sea (Schlesinger 1990). This outflow is joined by a flux of 0.4 PgC yr−1 of dissolved inorganic carbon (DIC) derived from the weathering of rock carbonates, which combine with atmospheric CO2 to form DIC. In total, 0.8 PgC yr−1 flow through rivers to the sea, where all of the DOC and half of the DIC are ultimately respired to the atmosphere. This leaves 0.2 PgC yr−1 to be deposited in deep-sea sediments as fixed carbonates, the remains of dead marine organisms. These deposits are the precursors of carbonate rocks. Over still longer time-scales, organic matter is buried as fossil organic matter (including fossil fuels), and CO2 is released into the atmosphere as a result of tectonic activity, such as vulcanism (Williams et al. 1992; Bickle 1994). These longer time-scale processes exert an important influence on atmospheric CO2 concentrations on geological time-scales (millions of years), but have had little influence at the time-scale corresponding to human expansion (100 000 years).
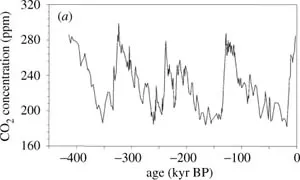
Changes in atmospheric CO2 over long and short time-scales
The description of the carbon cycle in Figure 1.1 is most relevant to the relatively constant climate of the Late Holocene, but atmospheric CO2 concentrations have not always been so stable (Figure 1.2). Very high concentrations of over 3000 ppm probably existed during at least two very early periods, 400 and 200 Myr BP (Berner 1997). As photosynthetic machinery evolved and became globally dominant, CO2 was drawn out of the atmosphere and there is geochemical evidence pointing to concentrations of less than 300 ppm by ca. 20 million years BP (Pagani et al. 1999; Pearson & Palmer 1999, 2000). It is likely, therefore, that atmospheric CO2 concentrations in the current century are significantly higher than at any time during the last 20 million years.
Figur...
Table of contents
- Cover Page
- Half Title
- Title Page
- Copyright
- Dedication
- Contents
- List of figures and tables
- About the contributors
- Preface
- Acknowledgements
- List of acronyms and abbreviations
- Introduction
- Part 1 Carbon and Climate Change
- Part 2 Environmental Services
- Part 3 The Future Model
- Index
Frequently asked questions
Yes, you can cancel anytime from the Subscription tab in your account settings on the Perlego website. Your subscription will stay active until the end of your current billing period. Learn how to cancel your subscription
No, books cannot be downloaded as external files, such as PDFs, for use outside of Perlego. However, you can download books within the Perlego app for offline reading on mobile or tablet. Learn how to download books offline
Perlego offers two plans: Essential and Complete
- Essential is ideal for learners and professionals who enjoy exploring a wide range of subjects. Access the Essential Library with 800,000+ trusted titles and best-sellers across business, personal growth, and the humanities. Includes unlimited reading time and Standard Read Aloud voice.
- Complete: Perfect for advanced learners and researchers needing full, unrestricted access. Unlock 1.5M+ books across hundreds of subjects, including academic and specialized titles. The Complete Plan also includes advanced features like Premium Read Aloud and Research Assistant.
We are an online textbook subscription service, where you can get access to an entire online library for less than the price of a single book per month. With over 1.5 million books across 990+ topics, we’ve got you covered! Learn about our mission
Look out for the read-aloud symbol on your next book to see if you can listen to it. The read-aloud tool reads text aloud for you, highlighting the text as it is being read. You can pause it, speed it up and slow it down. Learn more about Read Aloud
Yes! You can use the Perlego app on both iOS and Android devices to read anytime, anywhere — even offline. Perfect for commutes or when you’re on the go.
Please note we cannot support devices running on iOS 13 and Android 7 or earlier. Learn more about using the app
Please note we cannot support devices running on iOS 13 and Android 7 or earlier. Learn more about using the app
Yes, you can access Capturing Carbon and Conserving Biodiversity by Ian Swingland, Ian R Swingland,Ian Swingland, Ian R Swingland in PDF and/or ePUB format, as well as other popular books in Economics & Economic Theory. We have over 1.5 million books available in our catalogue for you to explore.