![]()
A general description of factor analysis
AIMS OF THE BOOK
Factor analysis is a statistical technique widely used in psychology and the social sciences. Indeed in some branches of psychology, especially those in which tests or questionnaires have been administered, it is a necessity. With the advent of powerful computers and the dreaded statistical packages which go with them factor analysis and other multivariate methods are available to those who have never been trained to understand them. I have examined countless theses in which the factor analytic results were simply a source of fear and confusion to the students who were praying that they would not be asked to explain them.
Furthermore, I am regularly approached by colleagues not only in my own university but in other departments of psychology and education, especially, for advice on interpreting and carrying out factor analyses. None of these colleagues and students is stupid. There are several reasons why they have failed to understand factor analysis. First, in Great Britain, at least among social scientists there is a general fear of mathematics. Equations freeze the mind, rendering it blank. Second, in many departments of psychology and education factor analysis is not well taught, or not taught at all, as I have found in teaching postgraduates. As in my time as a postgraduate, students are referred to a number of ‘excellent books, which tell you all you need to know’.
Regrettably, it is precisely these books which are the source of the problem. First let it be said that there are a number of excellent books on factor analysis and later in this Easy Guide I shall refer to them. However, except to mathematicians and those who have a reasonable knowledge and insight into factor analysis, they are unreadable and close to incomprehensible. Indeed only one book, to this writer's knowledge, has ever attempted to simplify factor analysis to a level which students might be expected to understand – Dennis Child's The Essentials of Factor Analysis (latest edition 1990). Even this book many students find too hard and some important aspects of the technique are not included. Why these books are so difficult stems from the fact that they are usually written by good mathematicians. These find mathematical arguments and the equivalence of apparently completely different formulae so obvious as to require no explanation.
The aim of the Easy Guide is to provide an explication of the basic mathematics of factor analysis which anybody who can manage any form of tertiary education can follow, so that, at the end of the book, readers will understand factor analysis. All mathematical terms, even the most simple, will be explained. All mathematical processes will be illustrated by examples. Readers will not be expected to make mathematical inferences. Each step will be explained. If the basic mathematics of factor analysis is understood, readers will then be able to use the technique effectively for research and, perhaps more importantly, they will be able to evaluate its use in journal papers. For much factor analytic research, as has been shown by Cattell (1978), is technically inadequate, rendering the results valueless. In addition I believe that, after reading this book, the excellent books to which I have already referred will become the useful texts which they were intended to be.
Finally I should like to say that the desire to write this book derived from my own personal experiences in working with factor analysis over almost thirty years. I came into psychology with no mathematical background and would have been entirely defeated by factor analysis had I not had the good fortune to work with Professor Warburton of Manchester University, who had the patience to explain what I could not understand without that contempt for one's stupidity which all too often accompanies mathematical or statistical explanation. I hope that the Easy Guide will provide just such an explication.
GENERAL DESCRIPTION OF FACTOR ANALYSIS
I shall begin with a general, verbal description of factor analysis, describing the aims and logic of the method, the kinds of questions it can answer, and its different varieties. I shall do this because I have found that the mathematical procedures become more comprehensible if the purpose and nature of factor analysis is already known.
What is factor analysis? Factor analysis consists of a number of statistical techniques the aim of which is to simplify complex sets of data. In the social sciences factor analysis is usually applied to correlations between variables and these must now be described.
Definition of a correlation coefficient A correlation is a numerical measure of the degree of agreement between two sets of scores. It runs from +1 to −1: +1 indicates full agreement, 0 no relationship and −1 complete disagreement.
Suppose we have two sets of scores in English and maths (Table 1.1).
Table 1.1 Scores in English and maths | Subjects | English | Maths |
| 1 | 100 | 100 |
| 2 | 95 | 95 |
| 3 | 91 | 91 |
| . | . | . |
| . | . | . |
| . | . | . |
| N | 0 | 0 |
In this example (which would be virtually impossible in real life), in which the scores of N subjects (note that N describes the size of a sample) on English and maths are set out, it is evident that there is perfect agreement. In this case the correlation would be +1. If the opposite had occurred and the top person in English had been the bottom in maths and the second person in English had been second from bottom in maths and so on through the list the correlation would have been −1.
Notice that with correlations of ±1 perfect predictions from one score to the other can be made. That is one of the important features of correlations in the social sciences: they enable prediction from one set of scores to another, although in real life correlations are almost never equal to ±1. The closer they get to 1 (regardless of sign) the higher the degree of agreement between the scores and thus the better the possible prediction. If correlations are squared the percentage agreement of the sets of scores is indicated.
Thus a correlation of 0.8 indicates 64 per cent agreement and 0.2 shows only 4 per cent agreement (0.2 squared is 0.04, not 0.4). A correlation of 0 indicates that there is no relationship at all between the two sets of scores.
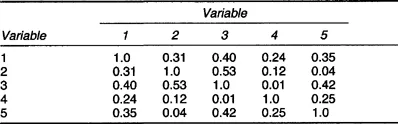
Definition of a correlation matrix A correlation matrix is a set of correlation coefficients between a number of variables.
Thus if we have five variables the correlation matrix will be of the kind shown in Table 1.2. The following points should be noted about this correlation matrix.
Table 1.2 A correlation matrix
1 Each variable is assumed to correlate perfectly with itself. In practice, which will be discussed in later chapters of this book, this is not always the case. What goes into the diagonals of the correlation matrix is important in understanding and interpreting factor analyses.
2 There is considerable redundancy in the matrix, each entry appearing twice, as it logically must.
3 Factor analysis is designed to simplify these correlation matrices. With as few as five variables there are 25 entries – which are hard enough to keep in one's head. In a large study with perhaps 100 variables there are 10,000 correlations. Without some simplifying procedure such a matrix would be incomprehensible.
4 In a large matrix of correlations, it is reasonable to ask what might account for the correlations. An example will clarify the point. Suppose that we have administered 100 different tests of ability and school attainment. In fact, the resulting correlation matrix would consist of positive and often high correlations in the region of 0.5 and 0.6. A factor analysis would reveal that these could be accounted for by a small number of factors: intelligence, verbal ability and spatial ability. Thus instead of having to look at the scores on a 100 tests to understand these correlations, which no human being is able to do, we could understand them in terms of three scores – on intelligence, verbal ability and spatial ability.
The example in (4) asserts and illustrates that factor analysis can simplify a matrix of correlations, but it is not meaningful without further explanation and this is set out below.
Definition of a factor As Royce (1963) has demonstrated, whilst there have been many different definitions of a factor there is a common underlying trend to them all. Essentially a factor is a dimension or construct which is a condensed statement of the relationships between a set of variables. This has been more pre-cisely refined by Royce (1963), who states that a factor is a construct operationally defined by its factor loadings.
This is an excellent definition although obviously factor loadings need to be defined.
Definition of factor loadings Factor loadings are the correlations of a variable with a factor.
Table 1.3 Illustration of a factor analysis | Variables | Factor 1 | Factor 2 | Factor 3 |
| Intelligence | 0.82 | 0.63 | 0.44 |
| Non-verbal IQ | 0.78 | 0.35 | 0.51 |
| Vocabulary | 0.68 | 0.64 | 0.21 |
| Rhyming | 0.28 | 0.59 | 0.18 |
| Algebra | 0.45 | 0.20 | 0.38 |
| Geometry | 0.50 | 0.17 | 0.69 |
| Physics | 0.41 | 0.13 | 0.37 |
| Latin | 0.58 | 0.70 | 0.20 |
| French | 0.32 | 0.68 | 0.17 |
| History | 0.25 | 0.43 | 0.12 |
| Engineering | 0.49 | 0.09 | 0.60 |
An artificial illustration will clar...