![]()
one
Environmental and
Energy-Security
Imperatives
This chapter briefly introduces the reasons why reducing energy use in buildings is of the utmost importance: as part of a broader strategy to avert potentially catastrophic climatic change (global warming); to help resolve serious issues of local and regional air pollution (ground level ozone, acid rain, trace toxic chemicals); as a hedge against early increases in the price of fossil fuels as extraction rates peak and then decline; and, in some regions, to address current or pending shortages of natural gas, which is used extensively for heating and for the production of hot water. It concludes with a working definition of ‘sustainable’ buildings, a term that is widely used without being defined.
The emissions of greenhouse gases (GHGs) (responsible for recent and projected climatic warming, as discussed below) and of almost all atmospheric pollutants are tied to the use of fossil fuels (natural gas, oil and coal) for energy. Buildings rely on fossil fuel energy, either directly through on-site use of natural gas, oil and (in some parts of the world) coal for space heating and for hot water, or indirectly through the use of electricity that is generated from fossil fuels. Reductions in energy use in buildings will lead to a reduction in the use of fossil fuels, thereby reducing emissions of GHGs and reducing local-to-regional air pollution problems.
1.1 The climatic imperative
A number of naturally occurring gases in the atmosphere – water vapour (H2O), carbon dioxide (CO2), ozone (O3) and methane (CH4) in particular – make the Earth's climate 33K warmer than it would be otherwise by trapping infrared radiation that would otherwise be emitted to space.1 This warming effect is popularly referred to as the ‘greenhouse effect’, and the gases contributing to it are called greenhouse gases (GHGs). Water vapour is the most important contributor to the natural or background greenhouse effect. However, during the past 200 years, humans have directly caused large increases in the concentrations of a number of other GHGs: the CO2 concentration has increased by over 30 per cent (from 280 parts per million by volume, or ppmv, to 380ppmv by the time this book is published), the methane concentration has increased by more than a factor of 2.5 (from 0.7ppmv to 1.75ppmv), the nitrous oxide (N2O) concentration has increased by about 15 per cent (from 275 parts per billion by volume (ppbv) to 315ppbv), and the lower atmosphere (or tropospheric) ozone concentration has increased by a factor of 2–5 (depending on location) in the northern hemisphere. In addition, several classes of entirely artificial GHGs have been created and added to the atmosphere, including the chlorofluorocarbons (CFCs) and their replacements, the hydrochlorofluorocarbons (HCFCs) and hydrofluorocarbons (HFCs). The buildup of these gases has strengthened the natural greenhouse effect, trapping an additional 2–3W/m2 of infrared radiation averaged over the Earth's surface and tending to warm the climate. The increase in CO2 concentration accounts for about half of this strengthening, while the increase of CH4 contributes another 20 per cent. The concentration of water vapour in the atmosphere has also increased, not as a direct result of human activity, but due to the warming of climate induced by the increases in the above-mentioned greenhouse gases. This constitutes a strong positive feedback that increases the expected warming by 50–100 per cent.
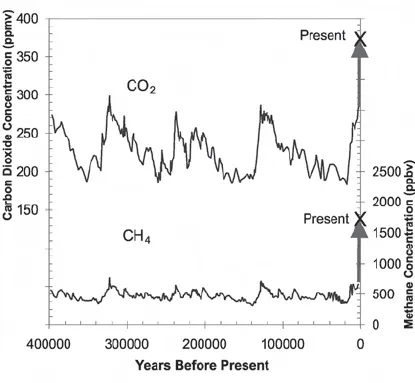
Figure 1.1 shows the CO2 and CH4 increase during the past 200 years in the context of natural variations during the past 400,000 years. Continuous direct observations of the atmospheric CO2 concentration began in 1958 at Mauna Loa, Hawaii, while systematic observations of the CH4 concentration began only in 1978. Concentrations prior to these times have been determined by measuring the gas concentrations in air bubbles in Antarctic ice cores, the deepest and oldest of which extend back over 750,000 years. As snow accumulates on an ice sheet, it is gradually transformed into ice, and the air present between the snowflakes eventually becomes sealed from the atmosphere as bubbles, thereby providing samples of past atmospheric composition. Both CO2 and CH4 have undergone repeated natural fluctuations, but the increases in the concentrations of these two greenhouse gases have been rapid (compared with natural fluctuations) and far outside the bounds of natural variability during the past 400,000 years.
Figure 1.1 Variation in atmospheric CO2 and CH4 (methane) concentration during the last 400,000 years as deduced from the Vostok ice core (Petit et al, 1999) (thin lines), and during the past 200 years (heavy line)
Source: Data in electronic form were obtained from the US National Oceanographic and Atmospheric Administration (NOAA) website (www.ngdc.noaa.gov/paleo)
CO2 is emitted to the atmosphere during the combustion of fossil fuels and from deforestation (commonly referred to as land ‘use’ changes). Fossil fuel emissions during the 1990s averaged around 6 Gigatonnes (Gt) of carbon per year, while land use changes caused a further emission of 1.6 ± 1.0Gt C per year (giga = billion; see Appendix A for the definition of this and other prefixes). The rate of fossil fuel emission could grow several-fold during the coming century, while long-term land use emissions are constrained by the availability of remaining forests and are unlikely to rise much above the current rate before declining. Thus, in the long term, fossil fuel emissions are of much greater concern than land use emissions as far as the buildup of atmospheric CO2 is concerned. Methane emissions occur in association with coal mining, extraction of oil and natural gas, distribution of natural gas (which is largely methane) and from rice farming, ruminant livestock (such as cattle), sanitary landfills, sewage treatment plants and biomass burning. Emissions from many of these sources are relatively easy to control, and methane molecules remain on average only 10 years in the atmosphere before being removed (largely through reaction with hydroxyl (OH)), so the methane buildup is largely reversible. In contrast, the natural processes that remove CO2 from the atmosphere are quite slow (requiring thousands of years to remove most of the emitted CO2), so the present and future increase in concentration is irreversible for all practical purposes.2 Furthermore, projected future increases in CO2 concentration under a typical business-as-usual scenario will dominate further increases in the greenhouse effect. For these reasons, CO2 emission from the combustion of fossil fuels will be the single largest factor in future human-induced warming of the climate and is of greatest concern.
1.1.1 Past changes of climate
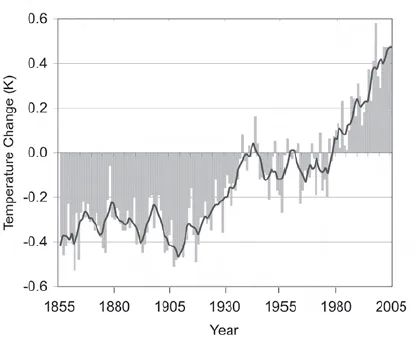
Figure 1.2 shows the variation in global average surface temperature over the period 1856–2005. This curve is a composite of sea surface temperature variations in the oceanic portion of the Earth, and surface air temperature variations over the land portion of the Earth (a detailed discussion of the methods used in constructing this curve can be found in Harvey (2000, Chapter 5)). These data indicate that the Earth's climate has warmed by 0.6–northward and upward movements of;0.8K, on average, during the past 140 years or so. There is an overwhelming body of independent evidence that, collectively, confirms that the Earth's climate is indeed warming: balloon-based observations of temperature in the middle atmosphere, reconstructions of temperature trends in the atmosphere from satellite data, an observed retreat and thinning of Arctic sea ice, reduced extent of snow cover on land in the northern hemisphere, reduced ice cover on lakes, northward and upward movements of climatesensitive plants and animals, a lengthening of the growing season in the northern hemisphere, warming of the land subsurface as measured in boreholes and a widespread warming of the upper 3000m of the ocean. However, one cannot judge whether the warming seen in Figure 1.2 is unusual or not without a longer record of globalscale temperature variation.
Figure 1.2 Variation in global average surface temperature during the period 1856-2005
Source of data: Climate Research Unit, University of East Anglia (www.cru.uea.ac.uk)
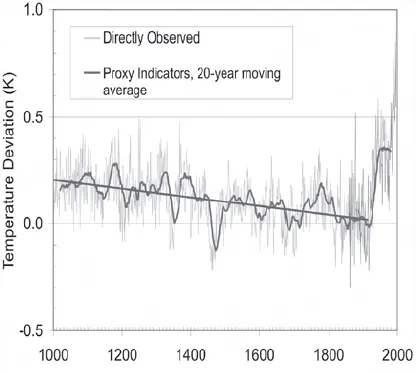
Fortunately, such a record is available, through temperature variations that can be reconstructed from the chemical composition of annual layers in polar ice caps, through the annual variations in tree-ring width (largely at middle latitude sites) and from the chemical composition of annual layers in coral reefs (from low latitudes). Figure 1.3 shows variation in northern hemisphere average temperature from AD 1000 to AD 1980 as reconstructed by Mann et al (1999). Also shown in Figure 1.3 are the directly measured variations in global average temperature from Figure 1.2. Prior to 1900, decadal-scale variations in hemispheric average temperature were generally no more than ±0.1K. Furthermore, there was a long-term downward trend of about 0.2K from AD 1000 to AD 1900. This trend was abruptly reversed, starting around 1900, and the warming during the past 100 years stands out as highly unusual. Methods of reconstructing past global-scale temperature changes and of quantifying the various factors that can potentially explain these changes are reviewed in Jones and Mann (2004). Alternative reconstructions of northern hemisphere temperature variations have been made, some showing greater century time-scale variability than shown in Figure 1.3. However, all scientifically credible reconstructions agree that the late 20th century is the warmest period during at least the past 1000 years (Kerr, 2005). There can be little doubt that this warming is largely due to the concurrent buildup of GHG concentrations during this time period, given that the heat trapping calculated from the measured increase of GHGs is more than adequate to explain the full magnitude of observed warming, while plausible alternative mechanisms (solar variability, volcanic eruptions, heat exchange with the deep ocean) have been comprehensively investigated and found to be capable of explaining only a small fraction of the observed warming (in the case of solar variability) or none at all (in the case of volcanic activity, which has had a net cooling effect, or in the case of heat exchange with the deep ocean, which has acted to passively dampen radiatively driven temperature changes).
Figure 1.3 Variation in northern hemisphere average surface temperature based largely on ice core, tree ring and coral reef data, as reconstructed by Mann et al (1999) (thin grey line), 20-year running mean of the annual paleoclimatic data (thick black line), and directly observed temperature variation of Figure 1.2 (thin black line)
Source: The proxy data of Mann et al (1999) in electronic form were obtained from the US National Oceanographic and Atmospheric Administration (NOAA) website (www.ngdc.noaa.gov/paleo)
1.1.2 Prospective future changes of climate
Given a scenario of CO2 emissions, the buildup of atmospheric CO2 concentration can be computed with reasonable accuracy using a computer carbon cycle model. Carbon cycle models compute the absorption of a portion of the emitted CO2 by the terrestrial biosphere (primarily by forests) and by the oceans. At present, between one half and two-thirds of the annually emitted CO2 is absorbed by these two sinks, while the balance accumulates in the atmosphere. Given a scenario for the buildup of CO2 and other GHGs, future climatic changes can be computed using a climate model.
The single most important parameter in determining the climatic response to a given GHG buildup is the climate sensitivity. This can be defined as the long-term, globally averaged warming for a doubling of atmospheric CO2 concentration. To a good approximation, the climate response to increases in CO2 and other GHGs depends only on the net heat trapping of all the gases, and not on the specific gases contributing to the heating. Thus, it is possible to speak of the equivalent CO2 concentration – the concentration of CO2 alone that would have the same heat-trapping effect as that from the mixture of gases present in reality. A wide variety of evidence (discussed in Chapter 9 of Harvey, 2000) indicates that the climate sensitivity is likely to fall between 2–3K, although a much broader range (from 1K to 5K or more) cannot be ruled out (Andronova and Schlesinger, 2001; Forest et al, 2002; Harvey and Kaufmann, 2002; Knutti et al, 2002). Under most businessas-usual scenarios, GHG concentrations rise far in excess of a CO2 doubling equivalent (see Prentice et al, 2001, figure 3.12) by 2100. It is evident from these considerations alone that dramatic changes in the world's climate will occur during the next century unless strong preventative action is taken.
Humans have also emitted precursors to a variety of suspended particles, known as aerosols, that have a net cooling effect on climate and have therefore offset a portion of the heating effect due to the buildup of GHGs. Were it not for this aerosol cooling effect, the warming during the last 100 years would have been larger. Aerosol particles remain in the atmosphere for only a few days before being washed out with rain, so they need to be continuously replenished. The primary aerosol – sulphate – is associated with acid rain, but sulphur emissions are being reduced in much of the world in order to reduce the damage caused by acid rain. As emissions are reduced, the aerosol cooling effect will weaken, leading to a temporary acceleration in global warming. The magnitude of the acceleration depends on how large the aerosol cooling effect is at present, something that is highly uncertain.
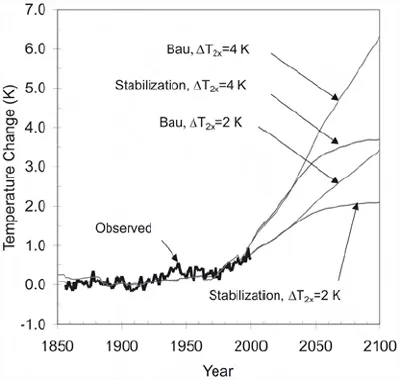
Figure 1.4 Comparison of the observed temperature record of Figure 1.2 (up to 2004) and global average temperature changes (up to 2100) as simulated using a simple climate model with prescribed climate sensitivities for a CO2 doubling (ΔT2x)) of 2K and 4K
Note: The assumed aerosol cooling effect in 1990 is 30 per cent of the greenhouse gas heating for a 2K sensitivity and 50 per cent of the greenhouse gas heating for a 4K sensitivity. In this way we obtain a reasonable fit to the observed warming for both assumed climate sensitivities. The simulations were extended to 2100 for a scenario in which fossil fuel CO2 emissions increase by a factor of four while total aerosol cooling decreases by a factor of two (labelled ′BAU′ - business-as-usual scenario), and for simulations in which the CO2 concentration is stabilized at 450ppmv.
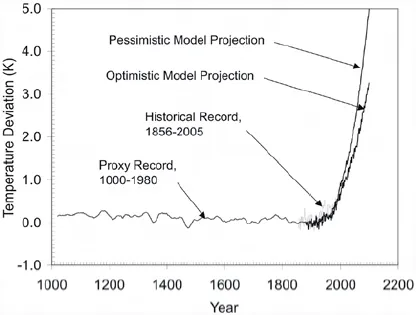
Figure 1.5 Proxy temperature variations of Figure 1.3, directly observed temperature variations of Figure 1.2 and business-as-usual model simulations of Figure 1.4
Figure 1.4 shows past and projected future global average warming for a typical business-as-usual scenario of increasing GHG emissions but falling aerosol emissions, for climate sensitivities of 2K and 4K (fossil fuel CO2 emissions grow from 6.4Gt C/year at present to 20.4Gt C/ year by 2100). The globally averaged warming by the end of this century ranges from 3K to 7K (accounting for uncertainties in emissions and in the carbon cycle). Even the optimistic case produces a warming by the end of this century comparable to the difference between the last ice age and the ensuing interglacial climate – a globally averaged difference of 4–6K. However, the warming that occurred at the end of the last ice age occurred over a period of 10,000 years, whereas comparable GHG-induced warming could occur over the next 100 years – 100 times faster. Also shown in Figure 1.4 are results where fossil fuel emissions are reduced to about 1Gt C/year by 2100, which might be sufficient to stabilize the atmospheric CO2 concentration at 450ppmv. Since this corresponds closely to the equivalent of a CO2 doubling, the global mean ...