Introduction
The global transport problem has now reached crisis proportions. The simplest everyday activities, involving no more than gaining access to work, education, recreation, shopping, friends, relatives and medical services, now consume a significant proportion of natural, financial, environmental and human resources. A useful way of visualizing the depth of the crisis would be to describe the policy that has created the global outcomes discussed in this book. Transport policies are either non-existent or cast in the general context of reducing road traffic congestion, reducing road traffic accidents (RTAs) and increasing levels of economic activity. The global outcomes of transport are normally at odds with these policy objectives and it is informative to undertake a backcasting exercise. What are the policies that would have produced the transport problems we are now dealing with? These policies would include the following:
- encouraging as many people as possible to make as many journeys as possible by car on the assumption that government will always find the cash to build the roads, tunnels, flyovers and bridges;
- providing as much government subsidy and encouragement as possible to car-based transport through loans, grants, road building, cheap fuel and every other expenditure that can be diverted into supporting this system (health care, policing, the courts system);
- ignoring the enormous advantages of walking and cycling for conferring health benefits, achieving accessibility at low cost and enhancing the aesthetics and ethics of the city;
- trying to ensure that children get as little exercise as possible and therefore become more unhealthy as a result of being carried everywhere in cars;
- encouraging as much use as possible of very large cars (ideally up to 2 tonnes in weight) by one person only;
- encouraging as many cars as possible to fill up the available road space (always in short supply in cities) so that these cars disrupt buses, making them an unattractive option and making life very difficult for pedestrians and cyclists;
- encouraging as many cars as possible to pollute the air, increase noise levels and kill children;
- donating as much land as possible to keeping this system going, especially if that land is needed for food production;
- always ensuring that wealthy groups and middle class groups are well looked after, with enough road space, parking and public expenditure; and
- always ensuring that pedestrians are inconvenienced as much as possible when trying to cross roads, making very sure that cars are never delayed by even a couple of seconds in order to give pedestrians easy road crossing possibilities.
No country in the world has a transport policy that even remotely resembles this ten-point plan. At the same time, every country in the world has achieved all or most of the policy objectives described in this list. The enormous power of the images sold by ‘automobility’, in combination with the political power of car builders and road builders, has produced a global system of ‘auto-dependency’ that has transformed the simple everyday experience of making contact with something into a perverse and damaging industry that consumes space, time, resources and people. The scale of the environmental damage caused by automobility is only surpassed by the damage to human rights. The rights of children to move around freely in most societies have been seriously curbed by the car; millions of people are subjected to harassment, forcible relocation and an assault on their senses by road, rail and airport projects; and the rights of future generations are seriously compromised by the profligate use of fossil fuels and its associated greenhouse gas (GHG) emissions.
In the remainder of this chapter we will set the scene for this Earthscan Reader on World Transport Policy and Practice by giving a brief introduction to the most important themes that are taken up in subsequent chapters. Some of these issues will then be revisited in Chapter 25, where new directions for world transport policy and practice will be outlined. The main themes to be covered are:
- growth in demand for transport;
- resource use;
- GHGs;
- urban air pollution and noise;
- health impacts; and
- RTAs.
Growth in Demand for Road Transport
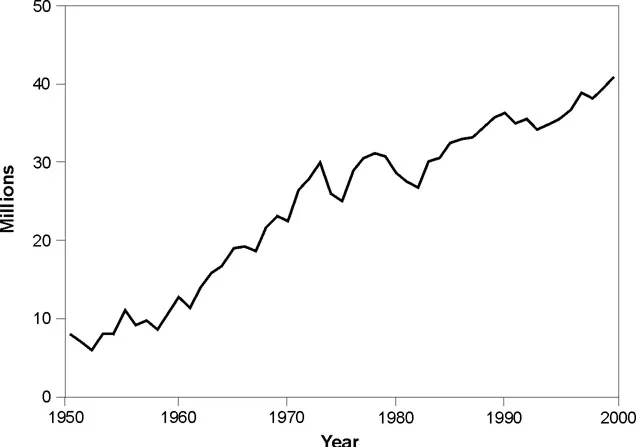
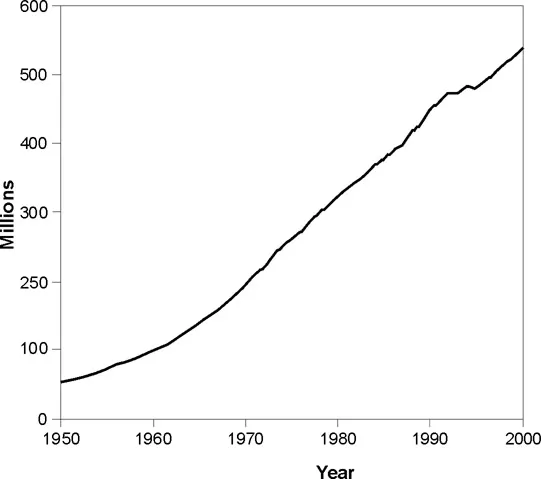
Global passenger car production reached a record 40.9 million vehicles in 2000 (see Figure 1.1) (Worldwatch Institute, 2001). Each one of these passenger cars carries with it an ‘ecological rucksack’ (ie, consequential waste and resource use) of at least 25 tonnes of discarded material. Each one consumes fossil fuel energy and produces GHG emissions, and each one denies pedestrians and cyclists a fair chance of independent mobility and accessibility in congested cities. Each vehicle is ‘responsible’ for the loss of 820 hours of human life (UPI, 1999). The size of the global vehicle fleet has grown significantly over the past 50 years. In 2000 the global passenger fleet was approximately 532 million vehicles (see Figure 1.2). The Heidelberg-based organization Umwelt und Prognose Institut (UPI) has forecast that by 2030 the global car population will be 2.3 billion (UPI, 1995).
Figure 1.1 Global vehicle production, 1950 to 2000
Of the total global fleet of 40.9 million motor vehicles, 47 per cent were produced in Japan, the USA and Germany. By 2005 Brazil, China and India are forecast to increase their production of passenger cars by 78 per cent, from 2.6 million (2000) to 4.6 million (2005) (Worldwatch Institute, 2001).
There are now 11.5 people per car in the world, but this average disguises huge discrepancies between developed and developing countries. In Europe and North America there are 2–3 people per car, and in India and China there are 224 and 279 people per car, respectively. In the USA and Australia the market is increasingly dominated by very large sports utility vehicles (SUVs), which are fuel-greedy and polluting. These vehicles have reduced the overall fuel efficiency of the fleet in these countries, with corresponding increases in GHG emissions.
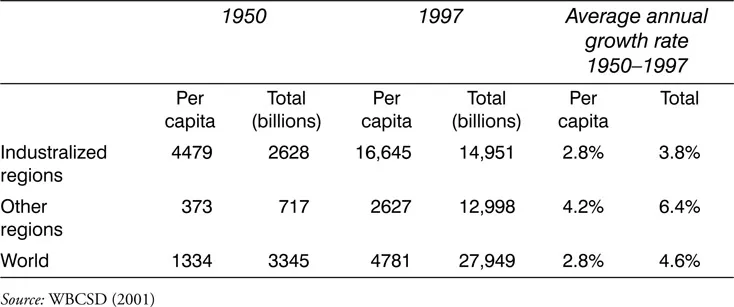
The annual distance travelled by each person on the planet has also been increasing. The average global growth rate of passenger kilometres (pkm) travelled has been rising by 4.6 per cent each year (see Table 1.1). In 1997, total pkm travelled in the industralized regions roughly equalled total travel in other regions. During the period 1950–1997, total distance travelled in industrialized regions increased fivefold compared to 1950. Developing countries have been also increasing their rate of travel, but on a per capita basis industrialized regions still travel six times further, at 16,645pkm compared to 2,627pkm.
Figure 1.2 Global vehicle fleet, 1950 to 2000
Table 1.1 Growth in global passenger kilometres travelled
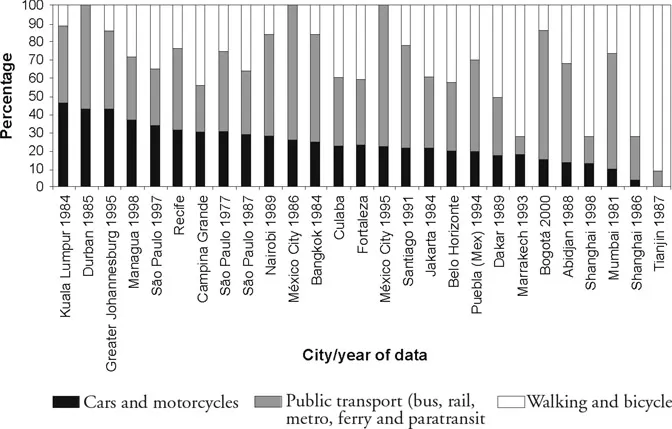
High rates of growth of car ownership and use are now becoming a common experience in many poorer countries of the world. The number of cars registered in Delhi grew from 1,830,000 in 1990 to 3,300,000 in 1999 (Japanese Bank for International Cooperation, 2002). Generally, motor vehicle ownership has increased in line with economic growth. High levels of motorization have been experienced in Asian countries such as Cambodia, China, the Philippines and South Korea, which have experienced high economic growth rates. As shown in Figure 1.3, despite the growth in global motorization, cities in the developing world are still dependent on public transport and on non-motorized means of transport such as walking and cycling (eg, Tianjin and Marrekech).
Figure 1.3 Modal share of transport in selected cities in the developing world
Globally, the supply of new transport infrastructure has increased steeply in recent years, with international financial institutions playing a key role in funding transportation infrastructure in developing countries. During 1983–1993 most of the loans of the World Bank were directed at intercity transportation such as motorways. In the same period, the Bank lent approximately US$2.5 trillion to urban transport projects throughout the world. Of this total, 60 per cent funded road building and maintenance projects, 17 per cent funded bus and rail systems, 10 per cent funded traffic management and 14 per cent funded technical assistance (IIEC, 1996).
Much of this increase has been in poorer countries where only a small percentage of the population can benefit from major new highway projects. In Calcutta (officially renamed Kolkata from 1 January 2001) the Japanese government-funded flyovers have increased traffic volumes and congestion in areas of the city ...