- 142 pages
- English
- ePUB (mobile friendly)
- Available on iOS & Android
eBook - ePub
Data-Driven Instructional Leadership
About this book
With real-world examples from actual schools, this book shows you how to nurture a culture of continuous improvement, meet the needs of individual students, foster an environment of high expectations, and meet the requirements of NCLB.
Trusted by 375,005 students
Access to over 1.5 million titles for a fair monthly price.
Study more efficiently using our study tools.
Information
Topic
EducationSubtopic
Education General1
Overview of the Data-Driven Instructional System Model
Making Sense Out of Chaos
As educational leaders, we are relentlessly told that we should use data to drive our instructional decisions. That makes perfect sense to most of us and comes as no big surprise. However, until now, no one has ever explained how to make that happen in a school district when so many ancillary components are bombarding the everyday operations of schools. How to begin to organize such a massive change in a school district and conceptualize the implementation of that change remains the biggest obstacle related to Data-Driven Instructional Systems (DDIS). How and when should the data be gathered, and what data should be included? How does using data to drive instructional decisions affect programming? How does using data to drive instructional decisions affect staffing? How does using data to drive instructional decisions affect what is actually taught at the classroom level? How does a district provide time for teachers and administrators to evaluate and analyze the data they do have? How does using data to drive instructional decisions affect professional learning? How does using data to drive instructional decisions affect goal setting? All of these questions—and more—need to be thought through and planned for before a district can begin to delve into a data-driven initiative. But this task is not as difficult or as overwhelming as it sounds when it is carefully planned and when the implementation is clearly mapped out for all district stakeholders.
In working with educators for almost 20 years—and having been a teacher myself—I have found them to be a very self-effacing group. Teachers do not like to draw attention to themselves, and they do not consider themselves better than anyone else. What happens when an educator from a successful school district is asked to explain exactly what makes his or her students so successful? He or she looks at you with a blank look and tries to explain in what can best be described as organized chaos. Many things coming from all angles in a school system contribute to students’ success in the classroom. Typically, there are so many components that make a school district successful that is difficult for those who are successful to describe what they do—or the part they play within the larger system. Often, the most successful educators view their success as simply a product of doing their job. It’s what they do every day. These people do not realize how incredibly rare it is to be able to put all of the pieces of the puzzle together in an organized manner while still improving student achievement and meeting the needs of all students. Wouldn’t it be helpful to capture the vision of these successful districts, teachers, and school systems and create a model for all school districts to follow? That is exactly what this book does.
I’d like to tell you a story about how I began thinking about this topic and how the model described in this chapter came to fruition. My district, fairly successful and progressive with the latest “cutting-edge” ideas in education, began to attract the attention of school districts across the state. They wondered exactly what was going on in my district that allowed us to be so successful. I have been asked on countless occasions to talk with administrative teams, teacher teams, curriculum councils, full district staffs, and even school board members about why my district has been so successful. Everyone wants to know what we are doing and how we are using data. Here is my story.
As one of those administrators who believed I was just doing my job, whenever I was asked why my district was so successful and what was going on, I would simply answer, “Oh, I don’t know that we are doing anything differently than other districts. We work hard and we pay attention to the data that we have on students. We adjust instruction accordingly and hope in the end that we have made a difference. We don’t worry about our performance on state assessments because we believe that if we do our jobs well, those assessments will take care of themselves.” Well, as I later found out, there is much more to district success than haphazard ideas that simply fall into place. It is no accident that we have been successful. You’ve all heard the saying that sometimes it is better to be lucky than good. Well, in this instance, you have to be good to be lucky! Designing and implementing a data-driven system that is the catalyst for school improvement must be a very calculated and meticulous process. Without realizing it, I had created such a system in my district—and I believe that school districts across the country can emulate this system in order to become as successful as we have been.
We are in our eighth year of using data to drive instructional decisions. It was not until the third or fourth year that I began to organize and document the evolutionary process that we were going through on our journey toward improvement. I discovered that this type of documentation was needed when school districts began to ask me what was going on in my district. Trying to explain a DDIS without a model was perplexing. Although what we were doing in my district made perfect sense to me, I found out that it was very difficult to communicate that to other districts in a manner that was easily replicable. When I discovered the need for this type of school improvement model, I decided that creating a model would be the perfect subject for my dissertation. Not only would a DDIS model assist other schools with their initiatives, it would help me make sense of the work we were doing in my own district. A model would help us organize the chaos.
As I contemplated the topic of my dissertation, I literally had a multitude of ideas scribbled across a white board that was approximately 20 feet long. I wanted to write about how other school districts could do what we were doing in my district to achieve success. I knew that what we were doing was making a difference, and I knew that if other districts did the same, they could be successful, too. I wanted to share my journey from the beginning to the present in the hope that it would be valuable to other districts who were seeking to become data driven. How was I going to make sense of all the components in a data-driven system that must work together for success? The question became, where should I begin?
With the help of my dissertation advisor, Dr. Richard Halverson, we made sense of the multitude of components that create a DDIS. The following model was developed at the University of Wisconsin–Madison as I wrote my dissertation.
Figure 1.1 Blink/Halverson Model for Data-Driven Instructional Systems (2005)
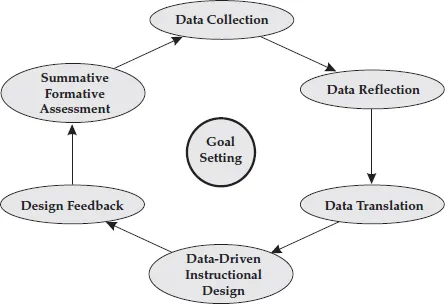
Each component of the DDIS model represents several branches of education that are commonly present in K–12 school districts. Every component of the model has its own chapter in this book. Those chapters provide specific examples, implementation ideas, and suggestions to assist teachers, principals, and school district leaders with the execution of data-driven initiatives. In the pages that follow, I will briefly describe each component and define the scope of the model. By no means does this brief introduction to the components of the DDIS model provide the reader with enough information to implement a DDIS model. The component-specific chapters are designed to provide a step-by step process with examples to help schools and districts move a data-driven school improvement initiative forward in their own district.
Data Collection
School districts that want to move toward a data-driven instructional approach need to understand what data they want to collect and for what purpose. The best way to work through this component is to utilize the work of Dr. Victoria Bernhardt and her four lenses of data collection. Bernhardt’s lenses of data include demographic data, perceptions data, student learning data, and school process data. Demographic data include information related to enrollment, attendance, ethnicity, gender, grade level, and English-language proficiency. Who are your students? What do they look like? What are their characteristics? Perceptions data are the values, beliefs, attitudes, and observations of the primary stakeholders in your district, including students, parents, teachers, community members, board members, support staff, instructional paraprofessionals, and administrators. How do the prominent stakeholders in your school district feel about the work that your district is doing? Are they satisfied with the programs that are offered and the academic performance of the students? Student learning data are the results of standardized tests, classroom observations of student achievement, authentic assessments, teacher checklists of student competencies, and any other tools that are used to measure student achievement. How are your students doing on their statewide assessments, local assessments, and classroom assessments? What does performance look like over time? Finally, school process data include information about the school programs and processes that are present in your school system. What programs are available? How are students identified for supplemental or gifted programs? Data should be collected in all of these areas to provide a clear picture of the school district, its students, and their performance.
How does a school or district determine which data to collect in each of the lenses and which data are meaningful to the cause? Create a Data Discovery Team in the district and discuss what types of data should be collected, how often they should be collected, how they will be collected, where they will be stored, how they will be accessed, and who will have access to them. Data collection also involves storing data in a data warehouse and relies heavily on the integration of information technology with the daily operations of schools.
Data Reflection
Data reflection is one of the critical components of the DDIS model but also one of the most difficult to structure. This component is the most complex to organize and requires the biggest shift in district philosophy. Districts have to be ready to focus everything that falls under this component on the use of data at the classroom level. In order to do that, schools need to provide teachers not only with the tools they need to collect data but also with the time they need to analyze and interpret those data. Everything from conferences and workshops to district professional learning days will look different in a DDIS school district. From the time teachers arrive in the morning until they leave at the end of the day, instruction and conversations about instruction must focus on the use of data for student learning.
School districts must realize that professional learning does not drive change—student achievement drives change. What I mean is that, all too often, school districts get stuck in an endless loop of sending teachers to conferences to listen to well-known speakers talk about what has worked in their districts while trying to convince conference attendees they should do the same. Teachers come back from those conferences and want to implement what they have learned. Though that isn’t all bad, it is bad if what they want to implement is not what their students need. We typically think of professional learning and student learning in the wrong order. We send teachers off to a conference and expect changes in student achievement after they have implemented what they learned at the conference. In fact, we should be doing the exact opposite: I believe teachers should be analyzing the student learning data they have and determining from that what types of professional learning they need to improve instruction in their classroom, which will eventually improve student achievement levels. However, in most districts that I’ve worked in or visited, teachers are attending conferences and workshops first and then looking at their data. Figure 1.2 displays the way professional development should be designed around students.
Figure 1.2. Student-Centered Professional Development
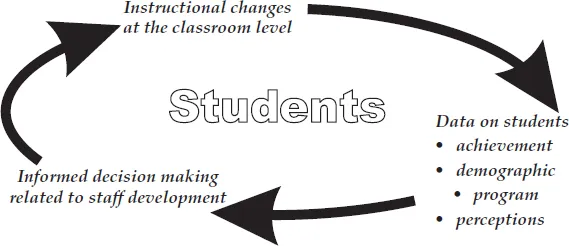
Copyright by Rebecca J. Blink, Ph.D.
For example, I worked in a school district for several years that said it wanted to practice 6 + 1 Trait Writing. For years, when asked whether they were doing 6 + 1 Trait Writing in their schools, teachers and administrators would say that they were. However, when I asked them why they were using 6 + 1 Trait Writing, no one could answer my question. From my point of view, if 6 + 1 Trait Writing is being implemented in a school district, there should be a reason documented with data that explains why that is necessary. If educational leaders can’t explain why they are doing some things in their schools, maybe they shouldn’t be doing them!
Data reflection makes time for stakeholders to examine data and identify areas in need of improvement. It relates directly to systemic change and school reform. This includes any school improvement planning based on data, and it might include events such as a Data Retreat at which district stakeholders gather to review data findings and address district needs. School districts and buildings within school districts will look different if they use the DDIS model. Unlike a typical school district, using the DDIS model forces districts to start with the data and then move on to analysis and professional learning. Without the DDIS model, professional learning typically comes before any data are analyzed or interpreted—and that is like putting the cart before the horse.
Data Translation
Data translation is the component of the DDIS model that begins to move the data to the instructional level. Data translation includes curriculum mapping, content adjustments, and instructional adjustments. This component of the DDIS model relates to systemic change and school reform, like the data reflection component. Both data reflection and data translation require change at the system level. Data reflection focuses more on changes in the staff culture, whereas data translation refers to actual programming and instructional changes that take place systemically for students. Data translation focuses on a large-scale curricular or program changes within a district.
Again, I will use an example from my own district to illustrate data translation. By analyzing data over several years, it became clear to me that we needed to do something—particularly at the elementary level—to improve our math instruction. Test scores over the past four years had indicated a weakness at our elementary school in a strand of our math standards known as “number operations and relations.” Even though we knew that students were performing low in relation to this strand and had talked about it, none of the changes that we made in the classroom had proved successful. Though we had several supplemental support programs in place at the elementary level for reading, we had nothing in place for math. After analyzing the data and determining there were no gaps in the curriculum (what should be taught), I decided to design a supplemental remedial math program based solely on identified student weaknesses on our district math assessment. Students are placed in this program, which we named Math Matters, based on their needs. It is not funded through any federal monies, so students can move in and out of the program as needed. The Math Matters program is a supplemental program in which students receive additional math instruction in 30-minute blocks up to three times per week. This is not an extension of their regular math class. This program was designed strictly to close achievement gaps for students with difficulties in math.
Since its inception in 2003, our Math Matters program has been extremely successful. What used to be a weak area for us on standardized tests—number operations and relations—is no longer a sore spot. We can report that 100% of the students serviced in the Math Matters program as third graders and dismissed at the end of their third-grade year scored proficient or advanced on the math portion of their state assessment after receiving no services over the summer or at the start of their fourth-grade year. To me, that indicates the students serviced in Math Matters not only learned the content but also retained it.
The Math Matters program is one example of data translation in my district. There are many more ways that data can translate into program or curricular changes, and those will be discussed later in this book.
Data-Driven Instructional Design
Data-driven instructional design, which includes the lessons of study and how to teach them, also corresponds with systemic change and school reform. Data-driven instructional design focuses on using data to inform instruction at the classroom level. Unlike data translation, which focuses more on the district and building levels, data-driven instructional design focuses on what is happening in the classroom. As school leaders, we can create all the programs we want, but if we don’t change the way teachers teach in the classroom, all the data in the world isn’t going to make a difference. Data-driven instructional design is at the heart of the DDIS model. The goal of any data-driven initiative must be to change instruction at the classroom level. The classroom level is where change needs to happen—but it cannot happen without the DDIS model in place to support the efforts of teachers.
Data-driven instructional design refers to the use of data by classroom teachers to plan instructional lessons and activities. This component of the DDIS model requires teachers to design and implement lessons that address the needs of their students. The data that inform instruction come from any number of sources: standardized tests at the state or district level, classroom tests, etc. Teachers must be taught how to use the information they have to create lessons that address the needs of all students in their classroom. Though the concepts taught typically remain the same, the strategies and activities used to teach the concepts differ.
It was at this juncture that my district introduced the concept of tiered lesson planning. Tiered lesson plans require teachers to analyze their classroom data, identify the current performance levels of their students, design lessons to address each child’s area of weakness, and teach the lesson to multiple levels of students at once. Examples of tiered lessons are included as Appendices B, C, D, and E.
We spent time training teachers how to look at their data so that they could determine the needs of their students and plan their lessons accordingly. The most important thin...
Table of contents
- Cover
- Title Page
- Copyright Page
- Dedication
- Table of Contents
- Acknowledgments
- Foreword
- Introduction
- 1 Overview of the Data-Driven Instructional System Model
- 2 Data Collection
- 3 Data Reflection
- 4 Data Translation
- 5 Data-Driven Instructional Design
- 6 Design Feedback
- 7 Summative and Formative Assessment
- 8 Summary and Results: Is It Worth It?
- 9 Conclusion
- Appendix A
- Appendix B: Example of a Tiered Lesson Plan for 8th-Grade Mathematics
- Appendix C: Guided Comprehension: Content Area Reading Strategies—Context Clues
- Appendix D: Newsletter Creation
- Appendix E: Tiered Lesson
- Bibliography
Frequently asked questions
Yes, you can cancel anytime from the Subscription tab in your account settings on the Perlego website. Your subscription will stay active until the end of your current billing period. Learn how to cancel your subscription
No, books cannot be downloaded as external files, such as PDFs, for use outside of Perlego. However, you can download books within the Perlego app for offline reading on mobile or tablet. Learn how to download books offline
Perlego offers two plans: Essential and Complete
- Essential is ideal for learners and professionals who enjoy exploring a wide range of subjects. Access the Essential Library with 800,000+ trusted titles and best-sellers across business, personal growth, and the humanities. Includes unlimited reading time and Standard Read Aloud voice.
- Complete: Perfect for advanced learners and researchers needing full, unrestricted access. Unlock 1.5M+ books across hundreds of subjects, including academic and specialized titles. The Complete Plan also includes advanced features like Premium Read Aloud and Research Assistant.
We are an online textbook subscription service, where you can get access to an entire online library for less than the price of a single book per month. With over 1.5 million books across 990+ topics, we’ve got you covered! Learn about our mission
Look out for the read-aloud symbol on your next book to see if you can listen to it. The read-aloud tool reads text aloud for you, highlighting the text as it is being read. You can pause it, speed it up and slow it down. Learn more about Read Aloud
Yes! You can use the Perlego app on both iOS and Android devices to read anytime, anywhere — even offline. Perfect for commutes or when you’re on the go.
Please note we cannot support devices running on iOS 13 and Android 7 or earlier. Learn more about using the app
Please note we cannot support devices running on iOS 13 and Android 7 or earlier. Learn more about using the app
Yes, you can access Data-Driven Instructional Leadership by Rebecca J. Blink in PDF and/or ePUB format, as well as other popular books in Education & Education General. We have over 1.5 million books available in our catalogue for you to explore.