![]()
1
Introduction1
Uwe Becker
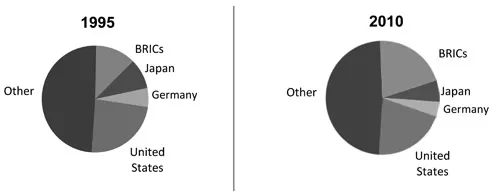
The global political-economic scene is fundamentally on the move. In the past fifteen to twenty years of the most recent wave of globalisation, it has dramatically changed. The background of this wave and subsequently of the changing proportions of global wealth and influence has been the breakdown of Soviet socialism, the triumph of the liberal doctrine of open global markets and the growth of financial interdependence that was facilitated by the worldwide penetration of the internet. The main feature of the new global political-economic picture has become, notably in the 2000s, the emergence of the economies of Brazil, Russia, India and China – summarised as the ‘BRICs’ – as big players and, partially, serious competitors to the advanced economies in the West and Eastern Asia, which, in relative terms, have declined. The global business cycle has also become largely simultaneous. The rise of the BRICs – the countries that will get the main attention in this volume – is accompanied by that of a number of mid-size and smaller economies such as those of South Africa, Turkey and the Central and Eastern European countries. Indonesia, the Philippines, Angola, Nigeria and Vietnam could also be mentioned. High gross domestic product (GDP) growth in these countries is one indicator, while their increasing share of world production (see Figure 1.1) and trade is another one. Global trade relative to world GDP increased from 39 per cent in 1992 to 52 per cent in 2005, and the share of non-Organisation for Economic Co-operation and Development (OECD) countries went up from 27 per cent to 36 per cent (OECD 2008b: 10). Since then, this process has continued (cf. the country shares in world exports in Table 1.1).
There are considerable differences between these countries, in size, wealth, performance, global impact, institutional structure and politics. These differences will be addressed or, as in the case of politics, touched upon in this volume. Some of the countries feature true emerging economies, while others are experiencing a comeback. The most spectacular cases are the highly populated China (1.33 billion inhabitants) and India (1.24 billion), both of which departed thirty years ago from very low levels. Particularly China has also started to become a competitor of the advanced economies in the West and East Asia when it comes to technologically sophisticated goods, and with its exports of cheap consumer goods it helps to reduce inflation in the rich economies, while its hunger for basic materials
Figure 1.1 Shares of world GDP 1995 and 2010, selected countries
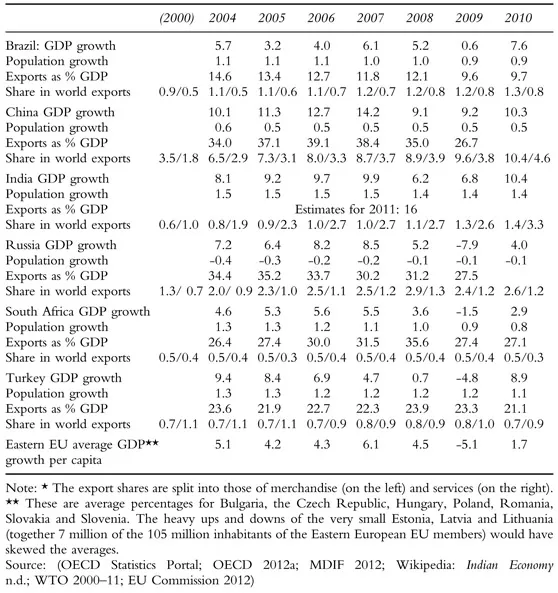
Table 1.1 Annual GDP growth, exports and export shares in the BRICs+, 2004–10 (in %)*
and machinery imports has become a driving force of the world economy as a whole.
These processes have recently received much attention. This is also true for the discussion on the theory of Varieties of Capitalism (VoC) with its dichotomous construction of liberal and coordinated capitalism. However, whether the BRICs and the other emerging countries fit into this dichotomy, which sorts of possibly fundamentally different capitalism or political economy – concepts I want to use synonymously – they reveal, and what change they have undergone in the past fifteen to twenty years is under-researched and under-theorised. This volume addresses these questions with respect to the BRICs, South Africa and Turkey (together the six countries are here indicated as BRICs+), and the two introductory chapters also provide some information on a few representative Eastern European countries: Estonia as an early liberaliser, Slovakia as a late but strong one, the Czech Republic as a modest one, Slovenia as a host of significant corporatism and Poland, the biggest Eastern European Union (EU) member, as a careful liberaliser.
Why this selection? The choice of the BRICs is evident, but why South Africa, Turkey and even a few Eastern European countries but not Indonesia, Mexico, Egypt or some other countries that are also ‘emerging’? South Africa is relatively small (52 million inhabitants) and its GDP growth is lower than that of the four BRICs, but it has been chosen because it has joined the club of the BRICs that annually meets as BRICS. It is nearly twice as rich as the more populous Egypt (90 million), while Nigeria, big (170 million) and only relying on oil, is still very poor. In Asia, something similar is true for Indonesia (237 million) and the Philippines (93 million) as a producer of cheap consumer goods. They are not emerging competitors. Just as Eastern Europe, Turkey (75 million), however, has become one, and its GDP has grown solidly in recent years. The latter is less true for the richer Mexico – a long-time OECD member.
The smaller Eastern European economies will only receive marginal attention in this and the next chapter. In part, they are very small: Estonia, with 1.35 million inhabitants, is 1,000 times less populated than China. Even Poland with about 40 million inhabitants is relatively small. It would be inappropriate to discuss them in direct comparison to the BRICs countries. As main contrast cases from the advanced economies, the USA and France or, in socio-economic matters, Sweden are chosen: the USA as the highly liberal leading world economy, Sweden as one of the relatively egalitarian Scandinavian countries, and France because its relatively high level of statism renders it best suited for the comparison to political economies where the state is also strongly present. Including their data in the statistics has to sharpen the view on the peculiarities of the BRICs+. The contrast cases will not be analysed, however.
The first goal of this volume is systematically and comparatively to inform about the selected political economies, to describe their institutional development and to identify the main changes in this respect, particularly concerning the state– economy and the capital–labour relations. We also want to contribute to the theoretical framework of this analysis by presenting a more open approach. We do not intend, however, to explain in depth the different trajectories of our selected political economies, as for example the high rise of China and the big problems of the Russian economy apart from oil and gas.
The volume is theory guided. We depart from the mainstream on capitalist varieties with its rigid conception of complementarities and its static classification of national political economies as either liberal or coordinated. We present a more open approach. Open means that institutional complementarities will be stressed much less and differently, and that the distinction between ideal types and empirical cases of capitalism will give space to grasp nuances and gradual change.
In this Introduction, I first summarise the socio-economic performances of the considered countries, notably of the BRICs+. The chapter also gives attention to social (inequality, poverty) and environmental (emissions, pollution) developments because these factors directly affect the conditions of daily life. Thereafter, I will discuss the topics of institutional complementarity and coherence. The question is how analytically to deal with economic expansion in a context where non-complementarity, as for example India demonstrates, is sometimes a foremost feature. The overview of the subsequent chapters is the closing part.
1.1 Socio-economic performances: an overview
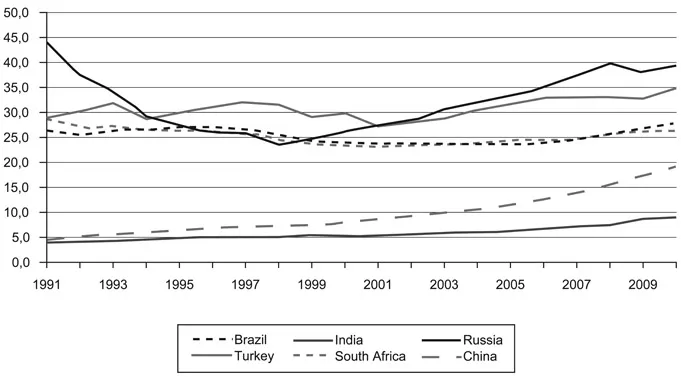
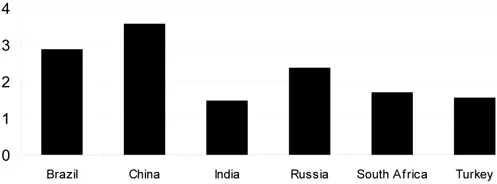
On closer investigation, it is remarkable that some emerging economies do not really belong to this category. No doubt, China, India and to a lesser degree Turkey are ‘emerging’, but this holds less for the other countries discussed here (see Figure 1.2). Brazil, South Africa and notably Russia rather are making a
Figure 1.2 Gaps in GDP per capita: BRICs+ to the upper half of the OECD countries
‘come-back’. Compared to the advanced economies, the Soviet Union in the 1980s had a higher GDP in PPP (purchasing power parity) per capita than Russia today. Thereafter, it sharply declined before growth returned in the late 1990s (the Eastern European countries did not experience this sharp decline). Figure 1.2 further shows still considerable income differences in PPP among the separate BRICs, South Africa and Turkey, as well as between them and the upper half of the OECD (the Anglo-Saxon countries, Japan, the Asian Tigers and north-west Europe). Russia is still the richest, India still a poor country and all of them have a long way to go to the level of the USA (or the slightly lower level of the north-western EU countries).
Comparing GDP per capita data (in PPP), one has to be aware of the enormous difference in the size of our countries. Particularly China has many provinces with a much higher GDP per capita than the national average, and these provinces are sometimes very large. Per head, in 2010, the provinces of Shanghai, Beijing and Tianjin (23 million, 20 million and 13 million inhabitants, respectively) were considerably richer than Russia and 2.5 times richer than China on average. Zhejiang and Guangdong (54 million and 104 million inhabitants; see Wikipedia on ‘administrative provinces of the People’s Republic of China’) had a per head income comparable to that of South Africa and Brazil. In the city of Shanghai, still larger than most Eastern European EU states, Portugal, Greece or Belgium, per capita income is even higher. One has to add that Moscow, Bangalore or Rio de Janeiro are also considerably richer than their national averages.
Table 1.1 provides a more detailed look at recent developments. The table shows real GDP growth and population growth. Overall GDP data, the basis for many other calculations, might be misleading. In Russia and some Eastern European countries, for example, GDP per capita is rising more than GDP because of a declining population, while it is increasing less in most other countries, notably in Brazil, India, South Africa and Turkey, because their populations are growing. So, to put GDP figures into perspective, population growth data, an important indicator by itself, are added. China has a relatively stable population because of its (not strictly practised) one-child policy. It also has the highest GDP growth of all. India, Russia (140 million inhabitants) and Turkey (75 million) did not perform much worse, though the latter two show a strong decline in 2009, the year of the global, particularly Western, financial crisis. Growth in Brazil (nearly 200 million) and South Africa (nearly 50 million) has been lower.
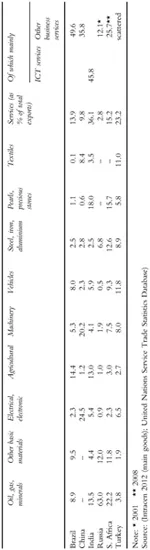
Looking at exports, the most remarkable countries are perhaps Brazil with its low rate and Russia with its extreme dependence on oil and gas, while China appears to be the export economy par excellence. Its figures might be more misleading than those of other countries, however. China assembles many goods the components of which are imported and then re-exported as parts of the final goods. Mobile (cell) phones are an example. So, its enormously increasing share in global exports has to be taken with a pinch of salt. At a lower level, the Indian share in global exports has also grown strongly and its service exports consist probably of fewer imported components than Chinese merchandise. The Indian percentage of services in total exports is by far the highest (Table 1.2). This country’s exports in the category of oil/gas and minerals are relatively high because it refines and re-exports oil (imported from Arab countries and Iran). Remarkably, this crowded country is a big agricultural exporter too. Brazil is also relatively strong in the agricultural market (among other things with basic materials for bio-fuel). China specialises in electronics, machinery and textiles; Turkish exports are spread across all sectors, with textiles and vehicles ahead (Toyota, for example, produces cars there); and South Africa heavily relies, but not as much as Russia, on basic materials and steel and iron, as well as pearls (diamonds).
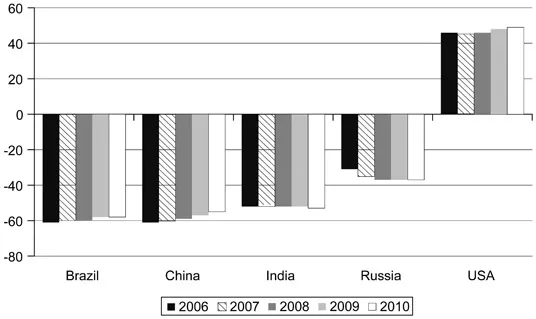
Related to exports and imports, the inflow of foreign direct investment (FDI) (see Figure 1.3) has been high in Brazil and China in the period since 1999, and remarkably high – given its strong reliance on gas and oil – in Russia. The figure shows net percentages (inflow minus outflow). The picture changes when one looks separately at the percentages (of GDP) of inflows and outflows. In relative terms, China is losing its lead then to South Africa, Brazil (OECD 2010a: 20) and Russia (UNCTAD 2011: 4, 9). The reason for this is that China’s FDI outflow is considerably lower than its inflow. Chinese FDI outflow is relatively modest and with 0.9 per cent of the global outflow in 2010 (India 0.4 per cent) it was about five times smaller than that of the USA. Fears of a Chinese take-over of the world economy appear somewhat exaggerated, therefore.
Considering growth data, the size of the population and the economy, economic specialisation and the impact on the world economy, it becomes clear that the story about emerging economies has first of all to be one on China. It is the most populated country on earth, its growth percentages are the highest of the economies discussed here, the same is true for its impact on international trade and its exported goods do not primarily consist of oil, gas, minerals and other basic materials, as is the case with Russia, South Africa and, less so, Brazil. China manufactures and exports middle- and high-tech goods and is increasingly becoming a real competitor of the advanced economies – even if the value added of its production of high-tech goods is still limited (OECD 2010c: 32). With different specialisations and on a lower level, India, Brazil and, to a much smaller extent, Turkey and the Eastern European countries also belong to this category of new competitors.
By and large, the picture is similar when we look at innovation. The innovation capacity of the advanced economies is still considerably higher than that of the BRICs and other countries discussed here. In Figure 1.4, this capacity is based on indicators such as the extent of tertiary education, the relative number of patents, cited publications, doctoral degrees, research and development (R&D) expenditure, and the volume of middle- and high-tech as well as knowledge exports (it excludes, however, spontaneous inventions on the work floor, which might be particularly relevant in emerging countries). In this figure, the BRICs+ and, for comparative reasons, the USA are put in relation to the average innovative capacity of the EU27. The figure reveals that the USA has a
Table 1.2 Export specialisations of the BRICs+ in 2010 in % of `main goods': exclusive services, columns 2–9; services as % of total exports and main service exports as % of total services, columns 10–12
Figure 1.3 Net FDI inflow (inflow minus outflow) as percentage of GDP, 1999–2011
Figure 1.4 Innovation performance of the BRICs and the USA compared to the average of the EU27, 2006–10
considerably higher capacity than the average EU27 country (the same holds for Japan, Switzerland, Denmark, Finland, Sweden and Germany).
Of the BRICs, Brazil – innovative in its field of agricultural materials – China and India are 50 to 60 per cent below the EU level (just as Turkey; Pro Inno Europe 2011: figure 8; no South African data), but only Brazil and notably China are closing the gap, while India stagnates. Closing the gap is a slow process, however, because most advanced economies continue to improve their innovative capacity. Particularly worth mentioning is Russia. Its innovation performance is ‘only’ about 35 per cent below the average EU level (on average, the Eastern European economies are comparable to Russia). In the 1950s, this country for the first time ever shot a human being into space, it still has many more researchers per 1,000 employed persons than China, India or Brazil (the respective figures are 6.7, 1.9, 0.2 and 1.3; cf. OECD 2009: 40f) and its population is still considerably higher educ...