An authoritative and detailed illustration of the state of journalistic practice in the United States today, The American Journalist in the 21st Century sheds light on the demographic and educational backgrounds, working conditions, and professional and ethical values of print, broadcast, and Internet journalists at the beginning of the 21st century. Providing results from telephone surveys of nearly 1,500 U.S. journalists working in a variety of media outlets, this volume updates the findings published in the earlier report, The American Journalist in the 1990s, and reflects the continued evolution of journalistic practice and professionalism.
The scope of material included here is extensive and inclusive, representing numerous facets of journalistic practice and professionalism, and featuring separate analyses for women, minority, and online journalists. Many findings are set in context and compared with previous major studies of U.S. journalists conducted in the 1970s, 80s, and 90s.
Serving as a detailed snapshot of current journalistic practice, The American Journalist in the 21st Century offers an intriguing and enlightening profile of professional journalists today, and it will be of great interest and value to working journalists, journalism educators, media managers, journalism students, and others seeking insights into the current state of the journalism profession.
eBook - ePub
The American Journalist in the 21st Century
U.S. News People at the Dawn of a New Millennium
- 304 pages
- English
- ePUB (mobile friendly)
- Available on iOS & Android
eBook - ePub
The American Journalist in the 21st Century
U.S. News People at the Dawn of a New Millennium
About this book
Trusted by 375,005 students
Access to over 1.5 million titles for a fair monthly price.
Study more efficiently using our study tools.
Information
Subtopic
Communication StudiesChapter 1
Basic Characteristics of U.S. Journalists
The statistical “profile” of U.S. journalists in 2002 is similar to that of 1992. The typical journalist then was a White Protestant married male in his 30s with a bachelor’s degree. In 2002, this average journalist was a married White male just over 40, less likely to come from a Protestant religious background, and slightly more likely to hold a bachelor’s degree. But this journalist was still more likely to work for a daily newspaper than any other type of news medium in 2002, to have attended a public college or university, to work for a news organization owned by a larger company, and to have not majored in journalism in college. As in 1992, this picture, based on averages, masks many of the important differences in U.S. news people that are discussed in much greater detail throughout this book.
This opening chapter examines the size of the journalistic workforce in the United States in 2002 as compared with previous decades, the geographic dispersion of U.S. journalists, their age and gender, their ethnic and religious origins, their political views, and their media use patterns. (See Appendix I, this volume, for details of the survey methods.)
Size of the Journalistic Workforce
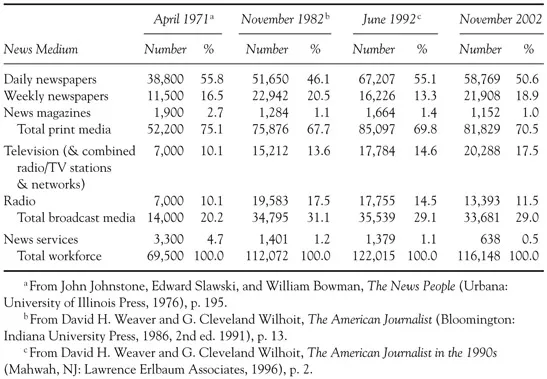
In 1971, Johnstone and his colleagues estimated the total full-time editorial work-force in U.S. English-language mainstream news media to be 69,500, with more than half employed by daily newspapers.1 In late 1982, we estimated this work-force to be 112,072, an increase of 61%, with slightly fewer than half employed by daily newspapers.2 In 1992, we estimated the total number of U.S. journalists working for mainstream news media to be 122,015, an increase of just under 9%, with more than half employed by daily newspapers (see Table 1.1).3 In late 2002, this number had dropped slightly to 116,148, a decrease of nearly 5%.
This estimated total includes only those journalists working full-time for daily and weekly newspapers, a handful of general interest news magazines that are published more than once a month, radio and television stations with news departments, and general wire service bureaus. It is likely that the growth in U.S. journalism during the past decade or two has been in specialized magazines and newsletters, both printed and online, and various cable TV network news organizations, rather than in the traditional news media included in our study. It is also likely that there has also been an increase in the number of part-time correspondents and freelancers working for U.S. news organizations. Thus, our estimate of the total number of full-time U.S. journalists is conservative, but it is consistent with the estimates of the previous studies conducted in the 1970s, 1980s, and 1990s.
TABLE 1.1 Estimated Full-Time Editorial Workforce in U.S. News Media
Although it is very difficult to obtain estimates of employment for all journalists or branches of the communication field, there are data from the U.S. Census and the Bureau of Labor Statistics on the total number of employees in the printing and publishing and communications industries. These figures show that the field of “communication” (which includes telephones, radio and television broadcasting, and cable and pay TV) grew from 1.3 million employees in 1990 to 1.6 million in 2000, an increase of 23%.4 Most of this growth was in telephone and cable/pay TV services.
On the other hand, the field of “printing and publishing” (which includes newspapers, periodicals, books, commercial printing, and bookbinding) declined slightly from a total of 1.57 million employees in 1990 to 1.56 in 2000. The largest decline was in newspapers (from 474,000 to 445,000), and the largest increases were in periodicals (129,000 to 146,000) and commercial printing (552,000 to 565,000).5
These figures include many technical and clerical jobs, of course, so they are only rough estimates of growth (or lack of it) in news or journalistic jobs in these broader fields. But they do raise questions about whether there will continue to be a decline in the number of U.S. journalists working for traditional news media during the next decade. More specific occupational data from the U.S. census show some growth in the number of authors from 1992 to 2000 (125,000 to 138,000), designers (542,000 to 738,000), photographers (129,000 to 148,000), editors and reporters (264,000 to 288,000), and announcers (53,000 to 54,000), but many of these jobs are not in traditional news media.6
Our estimates of U.S. journalistic employment do not include part-time correspondents, freelancers, or stringers working on an occasional basis, and our estimates are subject to varying amounts of sampling error because they were based on different sized random samples of news organizations in relation to their actual numbers. (For more details on how these estimates were calculated and how our sample of journalists was drawn, see Appendix I, this volume.)
Table 1.1 suggests that the proportion of U.S. full-time journalists working for daily newspapers declined from 1992 to 2002, whereas those working for weekly or nondaily papers increased, and those working for news magazines declined slightly. Overall, the proportion working for these traditional print media remained virtually constant at 70% during this decade (see Table 1.1), but the actual numbers declined by more than 3,000. Likewise, the percentage working for the broadcast media of radio and television remained essentially constant at 29, but employment in radio decreased and in television it increased, both by 3 percentage points. The actual number of broadcast journalists declined by almost 2,000, however. The number of journalists working for the bureaus of the major wire services of Associated Press (AP) and Reuters also declined from 1992 to 2002, mainly because of the sharp decline of United Press International (UPI) during this decade.
On balance, then, we estimate nearly 6,000 fewer full-time journalists working for traditional mainstream U.S. news media in 2002 as compared with 1992. It should be remembered, however, that our definition of journalist follows that used in the previous studies of 1971, 1982–1983, and 1992—those who have editorial responsibility for the preparation or transmission of news stories or other information, including full-time reporters, writers, correspondents, columnists, news people, and editors. In broadcast organizations, only news and public
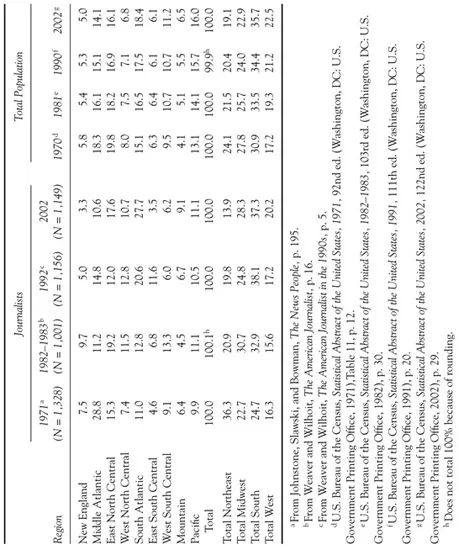
TABLE 1.2 Regional Distribution of Journalists Compared With Total U.S. Population (Percentage in Each Region)
affairs staff are included. Editorial cartoonists, but not comic-strip cartoonists, are included.
In this study and in 1992, we included photographers as journalists; in 1971 and 1982–1983 only photographers who were also reporters were included. We made this change in 1992 because we reasoned that photojournalists had more discretion than in the past about which pictures to shoot and were more likely to write text to accompany these pictures. As in the previous studies, we excluded librarians and visual and audio technicians because most of them are directed by reporters and editors (or assist them) and therefore do not have direct editorial control over the information that is communicated to general audiences.
Geographic Distribution of Journalists
Johnstone and his colleagues argue that, from its beginnings, the American news industry has been concentrated in the Northeast, largely because that region was the center of population of trade and commerce.7 In 1971, the Johnstone study found journalists overrepresented by 12% in the Northeast, as compared with the total population, and underrepresented in all other major regions of the country (see Table 1.2). During 1982–1983, there was a dramatic decline in the percentage of journalists working in the Northeast, significant increases in the proportions employed in the North Central (Midwest) and South regions, and almost no change in those located in the West. In 1992, the proportion in the Northeast remained constant, with a small decline in the North Central (Midwest) and small increases in the South and West (see Table 1.2). In general, the changes in the 1980s were minor compared with those in the 1970s, as one might expect from the negligible growth in U.S. journalism in the 1980s. Likewise, the changes during the 1990s were not major. The largest decrease was in the Northeast (almost 6 percentage points), and the largest increases occurred in the Midwest (3.5 points) and the West (3 points).
The proportion of journalists living and working in different regions of the country in 2002 and 1992 matched the distribution of the overall population fairly closely—certainly more than in 1971. Table 1.2 shows a pattern of growth in journalists in the South and West regions of the country during the 1980s and 1990s that parallels the growth in overall population in these regions. But in terms of national prominence and influence, it is still true that the major broadcast networks, news magazines, news services, and some of the most influential newspapers tend to be heavily concentrated in the Northeast, so the regional imbalances in prestige and influence are much greater than Table 1.2 suggests, as was true in the three earlier studies. This point is reinforced by our data on journalists’ media exposure patterns presented later in this chapter.
TABLE 1.3 Distribution of Journalists by Region and News Medium (Percentage in Each Region in 2002)
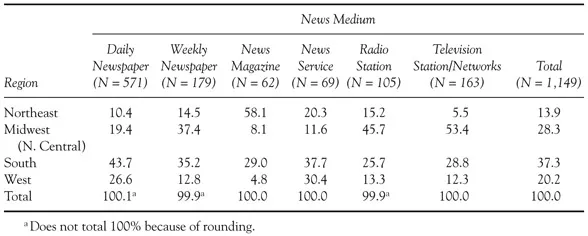
Table 1.3 also reflects the overall U.S. population growth in the South and the West. Only news magazine journalists continue to be disproportionately clustered in the Northeast, and radio and TV journalists in the Midwest region. Table 1.3 shows the majority of daily newspaper and news service journalists working in the South and West, but overall the Midwest and the South are the regions with the most full-time journalists.
Age and Gender
On average, U.S. journalists were older in 2002 than in the three previous decades, but no more likely to be women, despite dramatic increases in women journalism students and increased emphasis on hiring more women in journalism in the 1980s and 1990s (see Tables 1.4 and 1.5). The median age of U.S. journalists was a bit higher than that of the U.S. civilian labor force, but the pattern is the same for both—a steady increase in average age since the early 1980s as the baby boomers move through the decades. The largest increase from 1992 to 2002 among journalists was in the 45–54 age category, whereas in 1992 the largest increase from 1982 was in the 35–44 bracket, and in 1982 it was in the 25–34 group.
In the early 1970s and 1980s, journalists were disproportionately clustered in the 25–34 age bracket as compared with the U.S. civilian labor force, and in the early 1990s journa...
Table of contents
- Cover
- Half Title
- Title
- Copyright
- Contents
- Preface
- 1 Basic Characteristics of U.S. Journalists
- 2 Education and Training
- 3 Journalists in the Workplace
- 4 Professionalism: Roles, Values, Ethics
- 5 Women Journalists
- 6 Minority Journalists
- 7 Online Journalists
- 8 Journalists’ Best Work
- 9 Conclusions
- Bibliography
- Appendix I: Methods
- Appendix II: 2002 Journalists Survey Questionnaire
- Appendix III: Coding Schedule for Questions Regarding Journalists’ Best Work
- About the Authors
- Name Index
- Subject Index
Frequently asked questions
Yes, you can cancel anytime from the Subscription tab in your account settings on the Perlego website. Your subscription will stay active until the end of your current billing period. Learn how to cancel your subscription
No, books cannot be downloaded as external files, such as PDFs, for use outside of Perlego. However, you can download books within the Perlego app for offline reading on mobile or tablet. Learn how to download books offline
Perlego offers two plans: Essential and Complete
- Essential is ideal for learners and professionals who enjoy exploring a wide range of subjects. Access the Essential Library with 800,000+ trusted titles and best-sellers across business, personal growth, and the humanities. Includes unlimited reading time and Standard Read Aloud voice.
- Complete: Perfect for advanced learners and researchers needing full, unrestricted access. Unlock 1.5M+ books across hundreds of subjects, including academic and specialized titles. The Complete Plan also includes advanced features like Premium Read Aloud and Research Assistant.
We are an online textbook subscription service, where you can get access to an entire online library for less than the price of a single book per month. With over 1.5 million books across 990+ topics, we’ve got you covered! Learn about our mission
Look out for the read-aloud symbol on your next book to see if you can listen to it. The read-aloud tool reads text aloud for you, highlighting the text as it is being read. You can pause it, speed it up and slow it down. Learn more about Read Aloud
Yes! You can use the Perlego app on both iOS and Android devices to read anytime, anywhere — even offline. Perfect for commutes or when you’re on the go.
Please note we cannot support devices running on iOS 13 and Android 7 or earlier. Learn more about using the app
Please note we cannot support devices running on iOS 13 and Android 7 or earlier. Learn more about using the app
Yes, you can access The American Journalist in the 21st Century by David H. Weaver,Randal A. Beam,Bonnie J. Brownlee,Paul S. Voakes,G. Cleveland Wilhoit in PDF and/or ePUB format, as well as other popular books in Languages & Linguistics & Communication Studies. We have over 1.5 million books available in our catalogue for you to explore.