The fully revised new edition of this textbook presents a well-balanced set of economic development financing tools and techniques focused on our current times of economic austerity. While traditional public sector techniques are evaluated and refocused, this volume emphasizes the role of the private sector and the increasing need to bring together different techniques and sources to create a workable financial development package. The chapters address critical assessments of various methods as well as practical advice on how to implement these techniques. New chapters on entrepreneurship, the changing nature of the community banking system, and the increasing need for partnerships provides critical insights into the ever-evolving practice of economic development finance.

- 424 pages
- English
- ePUB (mobile friendly)
- Available on iOS & Android
eBook - ePub
Financing Economic Development in the 21st Century
About this book
Trusted by 375,005 students
Access to over 1.5 million titles for a fair monthly price.
Study more efficiently using our study tools.
Information
Subtopic
Business GeneralIndex
EconomicsPart I
Introduction
1
Local Economic Development and Its Finance
Local Economic Development and Its Finance
An Introduction
Stephen Malpezzi
Since the previous edition of this volume, the United States has experienced the end of the longest continuous economic expansion in our history, followed by the “Great Recession” (officially dated December 2007 to June 2009), and, as of this writing, a “recovery” that may be charitably labeled anemic. Of course, by the time you read this chapter, much more will have happened to move the GDP and employment aggregates—we hope, forward. However well or poorly the U.S. aggregate economy performs, it is worth reminding ourselves (especially if we describe ourselves as “macroeconomists”) that every economy is, in fact, a summation of the performance of hundreds of local economies. In my classes I like to make the provocative (and only slightly overstated) argument that nobody finds a job in the United States, or buys or sells a car in the United States, or makes a real estate investment there. We find jobs, buy and sell things, and save and invest in Madison or Milwaukee, in Manhattan or Miami, or some such local labor market, retail market, or real estate market.
This book, then, is about understanding this on-the-ground performance of these local economies. In this chapter, we have three specific objectives. First, we briefly discuss what is meant by economic development. Second, we provide a short overview of the general role finance plays in economic development. Third, we briefly introduce some of the particular ways local economic development (LED) is financed in the United States.
What Is Economic Development?
Economic development is surprisingly difficult to define precisely. What is our goal, and how can we measure our progress in reaching it? Is it the number of jobs, income or wages, wealth, an improved distribution of income, educational and health outcomes, structural change, or a better environment? Or is it the “quality of life,” measured in some broad way, incorporating noneconomic as well as economic factors? All these elements are valid components of the multidimensional thing we call development. As we will see later in the text, it is fortunate that many positive measures are at least roughly correlated; for example, actions that increase employment also tend to increase wages and income, and even to some extent improve the distribution of income.1
If you meet an economist in the street and ask her what the best measure of development is, she’ll probably reply, “welfare” or “well-being.” Since we can’t easily measure welfare directly, at least in a reliable fashion, we can think of things like income and employment as intervening variables that enable one to attain a higher degree of well-being. Generally a person’s welfare is greater if their income rises; and generally a person is better off with a job than if unemployed.2
The use of measures like income or gross domestic product in evaluating development is hardly surprising; despite criticism, and greater availability of alternatives, these indicators remain the most popular kinds of summary measures of development. Over the long run and in the aggregate, of course, income and gross product or output are closely linked. In the short run and from person-to-person and place-to-place, these can diverge. For example, localities with large numbers of retirees will have a larger gap between output and income than localities with few retirees.
Many local economic development “practitioners” (local politicians, policy wonks, and applied academics) focus on employment as a gauge of development. Employment matters, of course, but income is probably more directly related to well-being, hence making it a better summary measure. If we look at differences from one metropolitan area to another, there is generally positive correlation between employment and income. Consequently, it’s not often that development practitioners have to make a choice to improve one at the expense of the other, at least in the long run.
Other development practitioners focus on the value of local real estate. This is particularly true of local government officials concerned with increasing the size of their tax base, especially in states like Wisconsin, New Hampshire, and New Jersey, all of which rely heavily on the taxation of real property.
Malpezzi (2002) presents empirical tests of the relationships between and among seven candidate measures of development, including income, employment, the size of the real estate stock, and the distribution of income. The results of a detailed statistical analysis show that in most respects the most common “usual suspects,” namely per capita income or output, and measures of employment, are well correlated with each other and with other potential measures. The most important exception is that income and employment measures are not strongly correlated with a more even distribution of income. However, even in this respect, it appears that faster growing metropolitan areas are usually seeing some improvement in their income distribution. Furthermore, there is even stronger evidence that higher incomes and growth are correlated with lower poverty rates (which is related to, but different from, the distribution of income per se).3 In the rest of this chapter, we will focus on income and employment, though we’ll say a little more about distribution as well.
U.S. Growth and Distribution: A Few Stylized Facts
In order to present some basic underpinnings for the discussion below, we need to present some stylized facts. In this chapter, we will focus on state-level data; more detailed comparisons, including metropolitan-level comparisons, can be found in Malpezzi (2002). Tables 1.1 through 1.3 present some basic data on population, employment, and real income per capita, and these data are for the 50 states, the District of Columbia, and the United States as a whole.4
From Table 1.1 we see that U.S. population grew more or less steadily over the past 30 years, from about 227 million in 1980 to an estimated 309 million in 2010, or an annual compounded growth rate of about 1.0 percent. The five largest states—California, Texas, New York, Florida, and Illinois—comprise 10 percent of the states but over a third of the U.S. population. Wyoming, on the other hand, barely breaks half a million in population, and there are another half-dozen states with populations under a million. Generally, the Midwest has been growing more slowly than the country as a whole, and a number of states in the South and West, such as Arizona, California, Colorado, Georgia, and Texas, are growing faster. The fastest growing state, Nevada, racked up an average growth rate about four times the national average; Arizona tripled the U.S. rate of growth, and Florida, Utah, Georgia, Alaska, and Texas grew about double the average. At the other extreme, West Virginia shrank slightly, and Pennsylvania, Iowa, North Dakota, Louisiana, and Ohio barely budged.
Table 1.1 also gives a quick look at some other basic demographics. The fifth and sixth columns present the percentage of each state’s population under age 16 and age 65 or older, respectively. Unsurprisingly, they are correlated, though not perfectly: states with a lot of older residents tend to have fewer children. Utah, Idaho, Texas, Georgia, and Arizona are among the youngest states, by either measure; Florida, West Virginia, Vermont, and Maine are among the oldest. But perhaps the most impressive variation among the states is in the fraction of their foreign-born population; immigrants comprise over a quarter of California’s population, while roughly a fifth of the populations of New York, New Jersey, and Nevada are foreign born. At the other extreme, the Dakotas, Mississippi, Montana, and West Virginia have attracted relatively few global migrants compared to the U.S. average of one person in eight.
Table 1.1
State Population
State Population
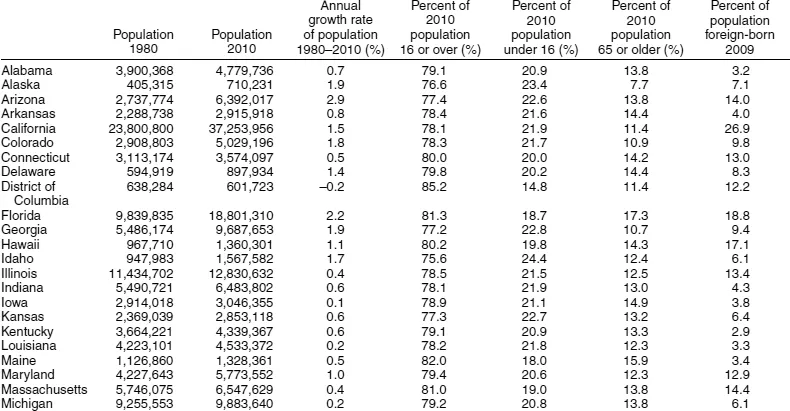
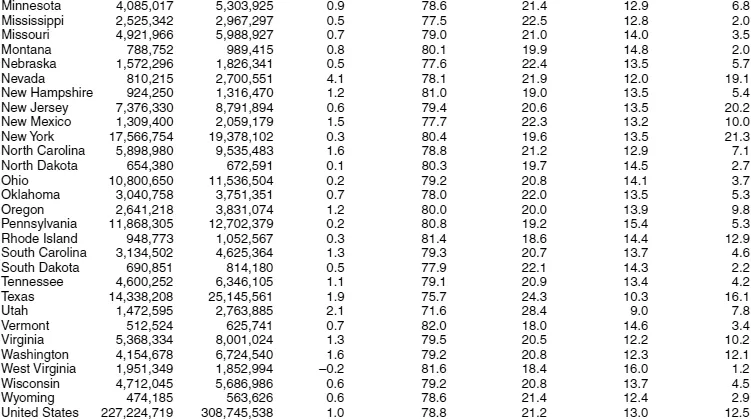
Sources: Foreign-born population from Pew Hispanic Center analysis of 2009 American Community Survey. Other data from the 2010 U.S. Census.
Table 1.2 shows that U.S. employment grew slightly faster than population over the past 30 years, from about 98 million in 1980 to about 137 million, or an annual compounded growth rate of 1.2 percent. If the reader were to compare this result to that reported in the previous edition of this chapter, where we examined the three decades from 1969 to 2000, she would find employment grew at about 2 percent per year, a much stronger performance. The Great Recession and its aftermath is an obvious candidate explanation, but they only explain part of the difference. During the 1960s and much of the 1970s, employment grew about twice as fast as population, as the “baby boom” and “baby boomlet” entered the workforce; at the same time, workforce participation by women increased. However, demographic forecasts tell us this pattern is not likely to hold over the next few decades.5 The rise in female labor force participation has tapered off, and the baby boom is retiring, while the baby “bustlet” is entering the labor force.
Table 1.2 also presents each state’s unemployment rate (annual average for 2010), and the ratio of each state’s employment to its population in 2009. Nevada, Michigan, and California are among the states with the highest rates of unemployment, as of this writing; the heartland states of Nebraska and the Dakotas have much lower unemployment than average. The employment-to-population ratio varies from 41 percent (Arizona) to 59 percent (North Dakota); Washington, D.C., is, of course, an anomaly. This employment-to-population ratio is in turn a function of the age structure of the population and the labor force-participation rate of those of working age, as well as unemployment. Notice that states with fast rates of employment growth (Table 1.2) are the states with high rates of population growth (Table 1.1). In fact, the correlation between population growth and employment growth is about 0.93, as strong as any correlation one would observe in such economic variables across states. By itself, this correlation begs the question of causality. Regional economists have long studied the question, do people follow jobs or do jobs follow people? The consensus view after many studies is that both effects can be found, but in the long run, the latter dominates.6 That is, the effect of an increase in population on future job growth is considerably stronger than the effect of an increase in employment on future population growth.
While population and employment are important, in many respects income per capita is an even better summary measure of local economic performance, since it is most closely tied to standards of living.7 As Table 1.3 shows, in 1980, average income per capita was about $23,260 for the United States as a whole in today’s (2010) dollars. Over the next 30 years, U.S. per capita income grew at about 1.9 percent to $40,584. Broadly speaking, at the rate of growth over this period, per capita incomes would double every 38 years. While we can find periods as long as a decade where ...
Table of contents
- Cover
- Half Title
- Title Page
- Copyright Page
- Table of Contents
- Foreword, Edward (Ned) Hill
- Preface
- Part I. Introduction
- Part II. Public Finance
- Part III. Private Finance
- Part IV. Partnerships
- Part V. Lessons Learned
- Index
- About the Editors and Contributors
Frequently asked questions
Yes, you can cancel anytime from the Subscription tab in your account settings on the Perlego website. Your subscription will stay active until the end of your current billing period. Learn how to cancel your subscription
No, books cannot be downloaded as external files, such as PDFs, for use outside of Perlego. However, you can download books within the Perlego app for offline reading on mobile or tablet. Learn how to download books offline
Perlego offers two plans: Essential and Complete
- Essential is ideal for learners and professionals who enjoy exploring a wide range of subjects. Access the Essential Library with 800,000+ trusted titles and best-sellers across business, personal growth, and the humanities. Includes unlimited reading time and Standard Read Aloud voice.
- Complete: Perfect for advanced learners and researchers needing full, unrestricted access. Unlock 1.5M+ books across hundreds of subjects, including academic and specialized titles. The Complete Plan also includes advanced features like Premium Read Aloud and Research Assistant.
We are an online textbook subscription service, where you can get access to an entire online library for less than the price of a single book per month. With over 1.5 million books across 990+ topics, we’ve got you covered! Learn about our mission
Look out for the read-aloud symbol on your next book to see if you can listen to it. The read-aloud tool reads text aloud for you, highlighting the text as it is being read. You can pause it, speed it up and slow it down. Learn more about Read Aloud
Yes! You can use the Perlego app on both iOS and Android devices to read anytime, anywhere — even offline. Perfect for commutes or when you’re on the go.
Please note we cannot support devices running on iOS 13 and Android 7 or earlier. Learn more about using the app
Please note we cannot support devices running on iOS 13 and Android 7 or earlier. Learn more about using the app
Yes, you can access Financing Economic Development in the 21st Century by Sammis B. White,Zenia Z. Kotval in PDF and/or ePUB format, as well as other popular books in Economics & Business General. We have over 1.5 million books available in our catalogue for you to explore.