Global trade pattern: history and today
The international trade of commodity products as well as the corresponding exchange of gold and silver over larger distances looks back on a long history. Merchants have walked, rode, and sailed on international trade routes for thousands of years. The most famous international trade path is probably the Silk Road, dating back to the first century Before Christ, stretching over 4,000 miles and connecting China to the Middle East, North Africa, and the Mediterranean. Because overland travel was slow and risky, mainly products with high value-to-bulk ratio yielding significant returns, such as luxury and spices, e.g. silk, satin, amber, porcelain, pepper, myrrh, and others, were traded. The Silk Road lasted for hundreds of years until the 15th century when maritime trade by the Spanish, Portuguese, Dutch, and British significantly increased its importance (McKenzie, 2013).
So, what are the main differences between today’s global business and international trade and trade conducted in the past? The answer to this question considers the following major aspects, which will be discussed in the subsequent sub-chapters:
• Liberalized global trade pattern;
• Industry digitalization and electronic (e-) commerce;
• Globally spread value added activities and operations;
• Importance of corporate social responsibility; and
• Increasing economic power of the Asian continent.
One of the reasons for the Great Depression at the end of the 1920s was the sharp increase of import customs, such as for steel, cotton, watches, and other products, because of protectionist government policies on both sides of the Atlantic, namely, in the US and Europe. Consequently, worldwide trade dropped tremendously and accelerated the global economic downturns. Worsening economic conditions contributed to emerging nationalistic parties in Europe at the beginning of the 1930s. Learning from history that worldwide trade has a tremendous impact on the national economies, the General Agreement on Tariffs and Trade (GATT), signed on October 30, 1947, provided the basis for tariff reductions through a series of multilateral negotiations also named ‘GATT rounds’ (Holtfrerich, 1991; World Trade Organization, 2010b). Today’s liberalized global trade pattern is a result of reduced tariff barriers (e.g. import duties and customs) in the last decades.
However, at the same time, so-called non-tariff barriers increasingly became an issue in global business. These non-tariff barriers contain, among other things,
• subsidies or tax benefits when provided for local firms only;
• escalating bureaucracy in terms of documentation when difficult to manage by foreign firms, such as approval procedure for product safety, hygiene certificates;
• accusation of dumping; or
• so-called buy national campaigns aimed at favoring local firms relative to products or services by foreign companies.
Compared to tariffs, the variations of non-tariff barriers are wide and more difficult to prove as ‘unfair’ by the foreign party. Additionally, the protection of intellectual property rights, which are of particular importance in services industries, had not been covered appropriately by GATT. Consequently, against the background intensified and more multifaceted global business concepts, such as in various service industries, the eighth GATT round, named the Uruguay Round of 1986–94, finalized the substitution of GATT by the World Trade Organization (WTO), which launched on January 1, 1995 (WTO, 2010a). Whereas GATT had mainly dealt with tariff barriers of manufactured commodity products, the WTO focuses on non-tariff barriers and the protection of intellectual property rights that are of particular importance in services industries. Furthermore, a dispute settlement system was established by the WTO. The main purpose behind the dispute settlement process in the WTO agreement and valid for all member nations is to settle conflicting interests through a neutral procedure before unilateral national legal actions are launched (World Trade Organization, 2010b).
The most recent negotiations of WTO were launched in Doha (Qatar) in November 2001. The agenda of the Doha Round is broader than past GATT agreements and is specifically targeted at addressing the needs of developing countries. The focus of negotiations has been to reform the agricultural subsidies of WTO member countries. In addition, the Doha Round addresses the improving access to global markets for firms originated in emerging countries and aims to ensure that new liberalization in the global economy respects the need for sustainable economic growth in developing countries. At the Bali Ministerial Conference in December 2013, ministers made several decisions, which addressed aspects of the Doha Round. Among others, it was decided that member countries need to provide transparent and non-discriminatory information on import and export procedures in their country, as well as ensure the establishment of risk management systems for customs control, and enhance transparency with regard to export competition. Furthermore, in dedication to supporting the development of least-developed countries, guidelines are established to allow members to support less developed countries through preferential treatment of their goods and services if this will be economically beneficial for the developing countries. As of January 2014, however, there are no further developments related to the Doha Round (World Trade Organization, 2015a).
Global trade flows
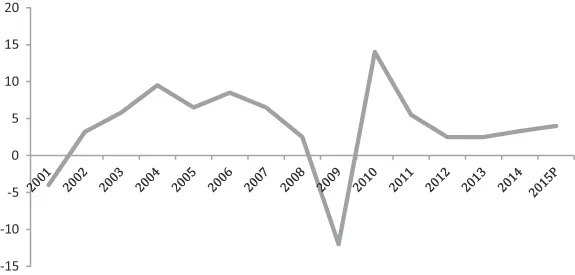
Over the years, except for more liberalized trade pattern, international trade has been influenced by various factors, including advances in information technology, financial crises, growing membership in the WTO, natural disasters, and geo-political tensions. These factors have led to volatility in commodity prices, changes in the leading traders and their trading partners, and the growing importance of services trade. According to the statistics, global trade experienced strong growth from 1995 to 2001, followed by a boom from 2002 to 2004 accompanied by rising commodity prices. The 2008 financial crisis, triggered by the subprime lending crisis in the United States, led to a global recession. As a result of the financial crisis, trade decreased dramatically in 2009 before rebounding strongly in 2010 and 2011. The volume of world exports plunged 12 percent in 2009 while world gross domestic product (GDP) dropped 2 percent. From 2011 to the present, trade growth has been stagnating (World Trade Organization, 2015b) (Figure 1.1).
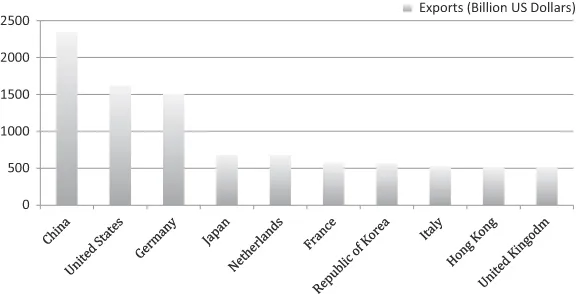
China’s accession to the WTO in December 2001 paved the way for its economic rise and contributed significantly to increasing world trade from 2002 to 2008. Another noteworthy event in the early 2000s was the introduction of euro coins and notes in 2002. Strong Chinese demand for natural resources contributed to increasing prices for crude oil and other primary commodities between 2002 and 2008 (World Trade Organization, 2015b). Already in 2009, China took over the position of a world export champion, which it successfully holds thus far, followed by the United States, Germany, and Japan. Figure 1.2 illustrates the ten leading merchandise export countries as of 2014.
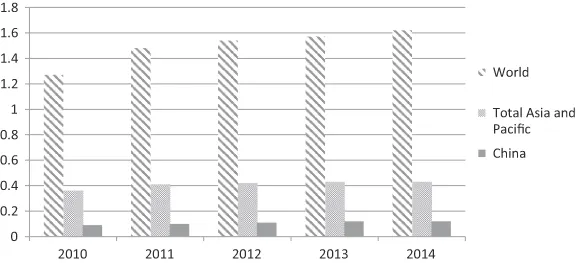
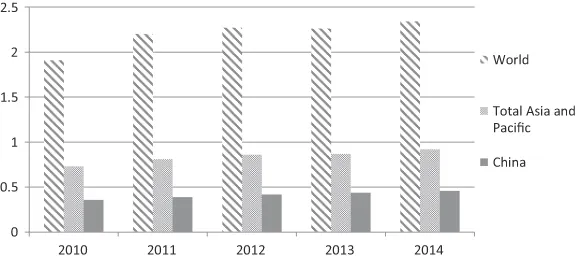
Considering the fact that China and the United States are among the world leading trade nations, it is interesting to compare the trade flows between those two countries. China is among the largest US trading partners (Morrison, 2015). Indeed, statistics show that the imports from China account for a substantial amount of all its imports from Asia-Pacific regions (Figures 1.3 and 1.4). Exports from China to the United States show a steady increase between 2010 and 2014 (United States International Trade Commission, 2015).
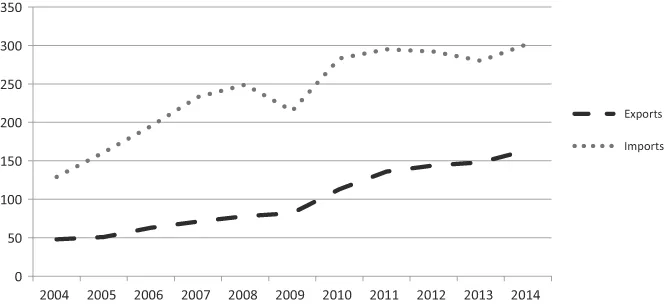
Statistics deliver empirical evidence that the European Union (EU) and China also maintain intense trade relations. Except for the drop recorded in 2009 following the financial crisis, the value of European Union imports of goods from China has increased significantly in the last decade, from Euro 129.2 billion in 2004 to a peak of Euro 302.5 billion in 2014. EU exports to China, which did not decline during the financial crisis, have more than tripled from 2004 to 2014 up to Euro 164.7 billion last year (Figure 1.5). The EU trade deficit with China, which continued during the entire period, decreased between 2010 and 2013 before growing again in 2014, reaching an amount of minus Euro 137.7 billion. China became the second most important EU trading partner behind the United States, accounting for 14 percent of total EU trade in goods in 2014 (compared with 9 percent in 2004). In this 10-year time period, the share of Chinese imports increased from 12.6 percent in 2004 to 18.0 percent in 2014, and its share in exports nearly doubled (5.1 percent in 2004 versus 9.7 percent in 2014) (EU China Summit, 2015).
EU trade in goods with China is clearly dominated by manufactured goods, which accounted in 2014 for 97 percent of total EU imports from China and 86 percent of EU exports to China. Among the EU Member States, Germany (Euro 75.0 billion or 46 percent of EU exports of goods to China) was by far the largest exporter to China in 2014, followed at a distance by the United Kingdom (Euro 19.6 billion or 12 percent), France (Euro 16.2 billion or 10 percent), and Italy (Euro 10.5 billion or 6 percent). Germany (Euro 60.9 billion or 20 percent of EU imports of goods from China) was also the largest importer from China in 2014, ahead of The Netherlands (Euro 57.3 billion or 19 percent), the United Kingdom percent (Euro 45.8 billion or 15 percent), France (Euro 25.4 billion or 8 percent), and Italy (Euro 25.1 billon or 8 percent). Every EU Member State recorded a deficit in trade in goods with China in 2014, except Germany (surplus Euro 14.1 billion) and Finland (surplus Euro 0.7 billion) (EU China Summit, 2015).