Strategies for Landscape Representation discusses a variety of digital and analogue production techniques for the representation of landscape at multiple scales. Careful consideration is required to represent time, and to ensure accuracy of representation and evaluation in the landscape.
Written as a guide for making appropriate selection of a wide variety of visualisation tools for students and built environment professionals with an interest in landscape, the book charts emerging technologies and historical contexts whilst also being relevant to landscape legislation such as Building Information Modelling (BIM) and Landscape Assessment. This book is an innovation-driven text that encourages readers to make connections between software, technology and analogue modes. The management, choice and combination of such modes can arguably narrow the unknown of landscape character, address the issues of representing time and change in landscape and engage and represent communities' perceptions and experience of landscape.
Showcasing international examples from landscape architecture, planning, urban design and architecture, artists, visualisers, geographers, scientists and model makers, the vitality of making and intrinsic value of representational work in these processes and sites is evidenced. An accompanying companion website provides access to original source files and tutorials totalling over a hundred hours in mapping and GIS, diagrams and notation, photomontage, 3D modelling and 3D printing.
Trusted by 375,005 students
Access to over 1.5 million titles for a fair monthly price.
In that Empire, the Art of Cartography attained such Perfection that the map of a single Province occupied the entirety of a City, and the map of the Empire, the entirety of a Province. In time, those Unconscionable Maps no longer satisfied, and the Cartographers Guilds struck a Map of the Empire whose size was that of the Empire, and which coincided point for point with it.
(Borges and Hurley, 2004, p. 181)
The Universe (which others call the library) is composed of an indefinite and perhaps infinite number of hexagonal galleries, with vast air shafts between, surrounded by very low railings…. Like all men of the library, I have travelled in my youth; I have wandered in search of a book, perhaps the catalogues of catalogues … in the vast library there are no two identical books … the library will endure: illuminated, solitary, infinite, perfectly motionless, equipped with precious volumes, useless, incorruptible, secret.
(Borges, 2000, pp. 78–86)
The Borges fable of a map of pure exactitude that covers the world is well known from citation by Baudrillard (1994),1 the uselessness of such a map even more so. The lesser-discussed Borges fable is the ‘Library of Babel’. The Library of Babel fable sets the scene of a dimly lit hexagonal library of knowledge where every book is equitable. This relativism of knowledge is the challenge landscape architects must work with. What is useful? What is relevant? What digital information gives physicality to landscape? Why are certain forms of landscape practice preferable over others? Between these two fables we could correlate the map, the site model and the data sets overlaid upon it. We are mapping, but also selecting from the library of knowledge. In that sense we must find the right ways of working, decoding and editing, but also realise that data (Kitchin and Dodge, 2014) themselves are not a complete solution for understanding landscape. Data are ideological, political, economic, cultural and social (Dodge et al., 2011).
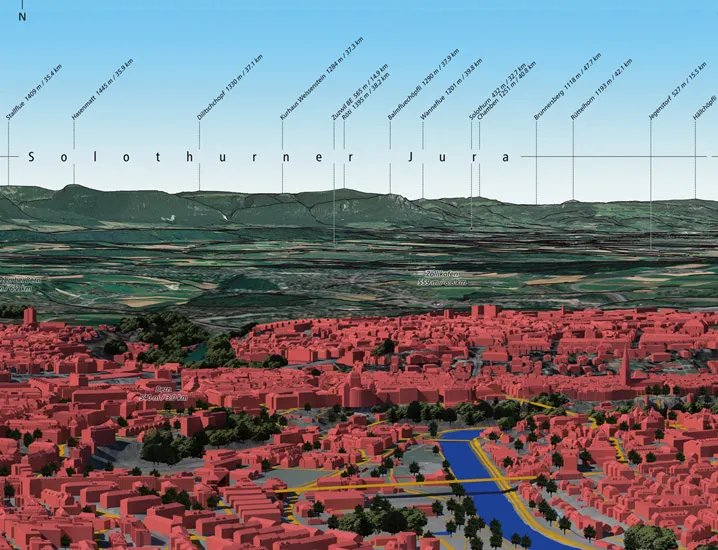
Figure 1.1 Swiss Maps, Digirama Deluxe. The landscape of this panorama is indicated from left to right by greyscale hill shading and silhouette lines as well as colour ramps and photo-realistic drapes. The annotation is derived from the ‘SwissNames’ data set and printed automatically, with a simple subsequent graphic editing.
We need strategies of representation, and the map is a strong source of representation from which to unpack possibilities. Landscape architecture has the potential to meet the challenge of large climate issues and change our environmental outlooks, as well as to create political consensus on the importance of our surrounding. This is not a utopian exercise to note; utopia has no place;2 the landscape envelops us. One important mapping drive has been the representation of relief on maps, as Florinsky argues (1998). The need to map relief in 3D terms is fundamental for the development of a landscape strategy based on climate, ecology, geology, physiographics and hydrology, as well as anthropogenic influences.3 Compared to extensive fieldwork, the use of remote-sensed data provides considerably cost-effective means of data collection of large land masses. Remote-sensing provides high-resolution data with which to strategise representation of landscape and strategise landscape itself. Therefore it could be understood that software and data choices in mapping define places, as well as regulate them.
The practical element of this chapter focuses on a number of options for desk-based research and the use of remote-sensing4– creating and reading landscape maps with 3D elements. A suitable data strategy means that the representation of landscape data is as much about the thinking and decisions involved in collation as is the actual data sets themselves. This chapter will discuss the rise of large-scale data packets and the use of innovative technologies in the capturing of landscape information. The chapter will also discuss the sharing, management and streamlining of this information, given BIM requirements. Several strategies for gathering landscape data are also discussed and the data sources can be accessed via the companion website (www.routledge.com/cw/cureton). Finally, emerging drone technology is discussed and a practical, cost-effective method is provided for mapping using drones and the generation of 3D data. The emphasis on drone use is based on its emerging capability and lack of context in landscape architecture, as well as its cost-effectiveness in data acquisition for students and landscape practices. Drones create new democratised paradigms and mapping practices.
One of the most compelling and representational modes of landscape has been the map. As Michel De Certeau observes,
The founding gesture is to make a map. It creates a space. It cuts out of the complexity of things a scene on which to draw the operations necessary to remake the world…. Born of a withdrawal and designed for a purpose, the map isolates a theatre and offers it up to be transformed. But that working ground also represents the reality from which the map distinguishes itself in order to change it.
(De Certeau, 1985, p. 17)
As data are gathered and a map forms into an image, this image becomes part of a performance; we believe its reality and from this belief we build on its surface, designing, drawing in pencil or polygons, often to change the map to the designed landscape plan, this quite simply is the agency of mapping in landscape architecture: between geography and design. The power of this agency gave rise to James Corner’s emancipatory mapping essay on the inauguration of new worlds out of old. There is much work still to be developed in detail and practice since this work (Corner in Cosgrove, 1999, pp. 213–252). For wider audiences, the map is the agent which allows comprehension of the place that is planned to be transformed. The data we and other associated disciplines collect reflect immense science and application in understanding of environments. Such a super-scale datascape means we need to think clearly on what is useful, selectable and applicable to the landscape site. Alongside this need, it is arguable that contemporary information technology seeks fidelity of the landscape it represents. Like the Borges fable, there is a large popular cartographic drive to simulate the world from across disciplines in a live-streamed high-resolution map (Cosgrove, 2012, pp. 1–2). Reality computing has come more to the fore, a digital simulation with near-accuracy of a location which can also be immersive through utilising augmented reality (AR) helmets, virtual reality (VR) booths and many other technologies. The precision that such work brings is welcome, yet the digital agency of landscape architecture mapping may result in furthering the distance with the subject itself. As Richard Muir’s book Approaches to Landscape evidences, there is a divided historicism of the landscape and its interpretation (Muir, 2000) and this technological drive may further the distance.
The simulation of landscape does not mean that we necessarily gain new knowledge, and this deficiency is often overlooked. In addition, as O’Sullivan and Perry demonstrate, computational simulations are complex, though such models often have a recurring structure (O’Sullivan and Perry, 2013). Thus, we may have a wider vocabulary and toolbox from digital development with which to represent landscape, but must be cautious not to concentrate our efforts purely in learning the tools; the use, thinking and strategy have greater importance. Analogue mapping is just as important; while digital technologies bring an uncontested fidelity, such drawing and mapping remains equally important in strategic terms as in the case of the first development sketch by Richard Buckminster-Fuller for his Dymaxion map.
Digital versus hand-drawn debates are fallacies that ignore the complexity of representation and differing production methods. When Ian McHarg created the ‘layer cake’ method of data in Design with Nature in 1969, geological, hydrological and ecological information layered together to find favourable or unfavourable sites (McHarg, 1995, pp. iv, v), the thinking and strategy was that the comparison of each of the fields made it comprehensible. McHarg wanted ecological understanding, though the book was limited by what it left out and has sometimes been misinterpreted as something that ticks the analytical stage of representation through attractive exploded axonometrics that do not hold under close scrutiny. McHarg wanted strategies for holistic landscape ‘the process of becoming’ (McHarg, 1995, p. 29). Many subsequent interpretations resulted in spaces and practices that cut up and dissected rather than developed the model. Carl Steniz developed the ‘layer cake’
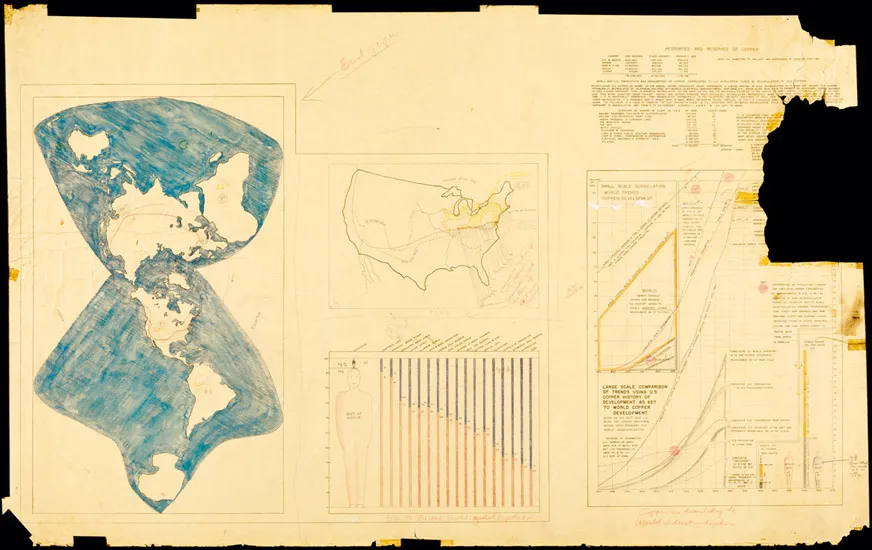
Figure 1.2 Richard Buckminster-Fuller, Dymaxion Projection method. Topological transfer of data from the globe onto the two-dimensional surface. Sketches undated, Pencil, c.1943. Buckminster-Fuller Archives. This flexible zone of spatial-cultural projection for Fuller, realised through drawing, helped formulate a corrective map projection towards his wider Spaceship Earth project – that is, worldwide collective pooling of resources out of a recognition of environmental and social injustice. This map has undergone several revisions in which various data could be composed, for example extending the ‘one continent’ idea, demonstrating world energy markets, developing the first comprehensive map showing air traffic patterns and another to show world population statistics (Fuller and Snyder 2009, pp. 171–173). The Dymaxion Map: ‘describes the Earth’s surface with the minimum total score of distortions from the many well-known geometrical processes inherent in translation of the angle and scale information from a spherical to a flat surface’ (Fuller and Snyder, 2009, p. 160).
model of overlays...
Table of contents
Cover
Title
Copyright
Dedication
CONTENTS
Acknowledgements
INTRODUCTION: REPRESENTATION, AGENCY AND VALENCE
1 WORKING WITH DATA (MAPPING)
2 LANDSCAPE, PARTICIPATION, NOTATION AND FIELDWORK (NOTATION AND DIAGRAMS)
3 TIME IN LANDSCAPE (COMPOSITES)
4 STRATEGIES FOR REPRESENTATION (3D MODELS)
5 LANDSCAPE MODELLING AND FABRICATION (MODELS)
6 CONCLUSION: FUTURE LANDSCAPES
Index
Frequently asked questions
Yes, you can cancel anytime from the Subscription tab in your account settings on the Perlego website. Your subscription will stay active until the end of your current billing period. Learn how to cancel your subscription
No, books cannot be downloaded as external files, such as PDFs, for use outside of Perlego. However, you can download books within the Perlego app for offline reading on mobile or tablet. Learn how to download books offline
Perlego offers two plans: Essential and Complete
Essential is ideal for learners and professionals who enjoy exploring a wide range of subjects. Access the Essential Library with 800,000+ trusted titles and best-sellers across business, personal growth, and the humanities. Includes unlimited reading time and Standard Read Aloud voice.
Complete: Perfect for advanced learners and researchers needing full, unrestricted access. Unlock 1.5M+ books across hundreds of subjects, including academic and specialized titles. The Complete Plan also includes advanced features like Premium Read Aloud and Research Assistant.
Both plans are available with monthly, semester, or annual billing cycles.
We are an online textbook subscription service, where you can get access to an entire online library for less than the price of a single book per month. With over 1.5 million books across 990+ topics, we’ve got you covered! Learn about our mission
Look out for the read-aloud symbol on your next book to see if you can listen to it. The read-aloud tool reads text aloud for you, highlighting the text as it is being read. You can pause it, speed it up and slow it down. Learn more about Read Aloud
Yes! You can use the Perlego app on both iOS and Android devices to read anytime, anywhere — even offline. Perfect for commutes or when you’re on the go. Please note we cannot support devices running on iOS 13 and Android 7 or earlier. Learn more about using the app
Yes, you can access Strategies for Landscape Representation by Paul Cureton in PDF and/or ePUB format, as well as other popular books in Architecture & Urban Planning & Landscaping. We have over 1.5 million books available in our catalogue for you to explore.