![]()
1
The Spatial Definition
A Time-honored Enigma
There’s the added element of adrenaline if you’re performing. You’re aware of spatial relationships and the music.
Kim Gordon
We begin our journey on spatial intelligence by introducing four figures that are shown in pairs. While examining these pairs, special attention should be placed on how they compare and contrast with each other. Moreover, consider the following questions: first, what is the significance between each pair of figures? And second, what relationship exists, if any, among all diagrams in each of the four pairs? Before answering these two questions, consider each photograph or diagram in each of the four figures (Figures 1.1, 1.2, 1.3, and 1.4).
As for the first question, what is the significance of Figure 1.1? We begin by emphasizing the need to represent objects, in this case, water molecules, as spatial representations. In Figure 1.1 a sixth grader, who did not yet learn specifically about water molecules in the science curriculum, was asked to represent her version of the behavior of water molecules in a one-liter flask containing approximately a half liter of liquid water just reaching the boiling point (100°C or 212°F). Her depiction of this account is astonishingly accurate—namely, her visual representation of the liquid water molecules show greater density and packedness in terms of proximity of location than that of the water vapor above the liquid water line. The water vapor shows more separation between molecules. It is also worthy of note to analyze our interpretation of the sixth grader’s spatial representation. In our own interpretation, we use terms like “proximity,” “above,” and “separation” to explain her visual representation. At the same time, from a cognitive perspective, if asked to represent a situation or phenomenon using a diagram, the sixth grader clearly cannot escape representing the task without employing constructs of spatial relations. The same case can be made with regard to Figure 1.1 on the right, namely, the tenth grader who is learning about the atomic composition through a visual account of the water molecule. What is fascinating here is that even at the atomic or microscopic level of physical reality, it is still possible to represent something spatially. Further, spatial considerations are given to the angular positioning of the two hydrogen atoms in relation to their bonds to the single oxygen atom—a measure that approximates 104.45 degrees. In most chemistry curricula, it is imperative for chemistry teachers to cover the angular positioning of atomic bonds within any given molecule. Through the lens of the water molecule, angular positioning of hydrogen atoms is important to learn because these figurations indicate how a single water molecule interacts with other water molecules. The topic of angular positioning of atoms in intra-molecular bonding clearly exemplifies the need for students to think spatially, both in terms of their understanding and in terms of eventual expertise in chemistry-related fields. Not only are these depictions spatial—i.e., spatial representations—but their referents, in other words, the water molecules themselves, are spatial, too.
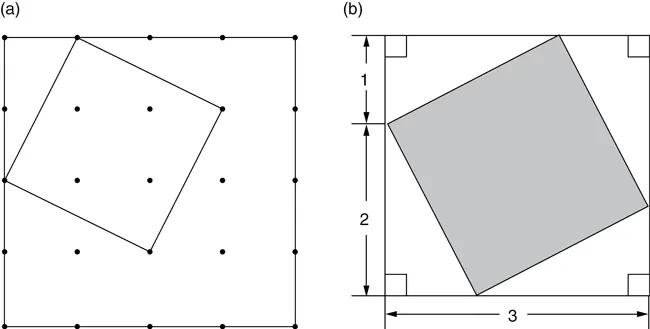
What about the significance of parts (a) and (b) of Figure 1.2? Figure 1.2a is a photographic representation of a Geoboard—a mathematical manipulative that is used to help students improve their conceptual formations of mathematical concepts, particularly those in geometry. In this specific Geoboard spatial representation, we can say that the rubber band that depicts the larger square consists of 16 small squares. Notice how the pegs, depicted by the dots are represented in terms of organization; they are neatly organized in rows and columns, and the distance between each peg can be considered equal to one unit. That is, a 1 unit × 1 unit square is equal to one square unit. The outer rubber band thus creates an inner square whose area is 16 square units. Moreover, if we stipulate that sides representing diagonals divide a rectangle into two congruent right triangles, it is then possible to determine the area of the interior square—five square units (we leave the explanation for the area of this square to the reader). The main idea here is that we are thinking and considering all the parameters involved in this example from a spatial perspective. Now, in terms of Figure 1.2a, b determining the area of a given square as a question on a college entrance examination, notice the similarity between this depiction of a square and the inner square represented in Figure 1.2a; without question, they are strikingly similar. In fact, the answer to the question in Figure 1.2b is the same answer that we find when determining the area of the inner square in Figure 1.2a. Again, these two visuals demonstrate spatial considerations; there is essentially no way around it. Students and other individuals who are introduced to the Geoboard or the question posed in Figure 1.2b are in essence required to think spatially. Again, notice our language when analyzing Figure 1.2a: “formation,” “geometry,” “square,” “organization,” “rows,” “columns,” “distance,” “square unit,” “inner,” “area,” “sides,” “diagonals,” “rectangle,” “congruent,” “outer,” “right triangles,” “constructed,” “Geoboard”—these are all spatial terminology. Regardless, from a cognitive perspective, anyone who comes into contact with a Geoboard or a question such as the one asked in Figure 1.2b will be required to exhibit and use spatial thinking skills.
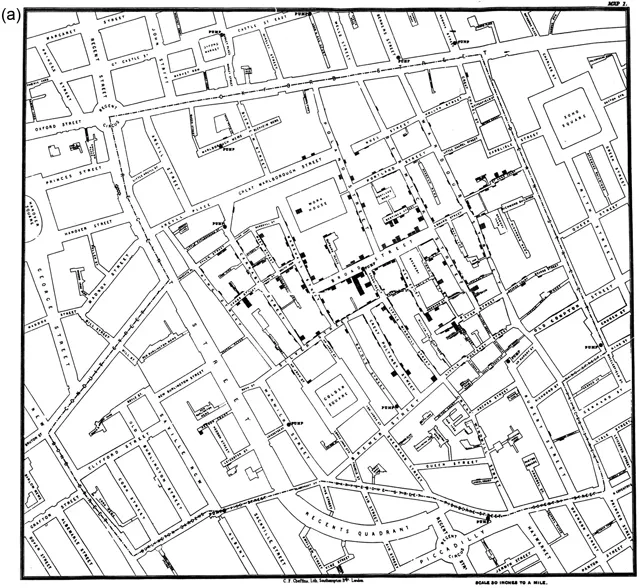
Next, what is the significance of parts (a) and (b) of Figure 1.3? To begin with, both diagrams demonstrate how spatial thinking plays a dynamic role in the field of epidemiology. Dr. John Snow, who developed methods that many would argue catapulted the field of epidemiology—the study of diseases and the spread of diseases by various contagions—into the limelight of medical and academic research, generated a map of Soho that listed all, or most, of the cholera cases in the Soho vicinity by indicating individual cases of cholera using hash marks. Snow produced this map in 1854—a time when contemporary technology included the nascent stages of the daguerreotype, steam engine, and processing mills. In other words, GIS, as we know it in the twenty-first century, did not exist, and all cases had to be documented by hand or etched onto paper. Early epidemiology was a dangerous way to earn a living in 1854 because the extent to which one could come into contact with tainted drinking water (in the case of cholera) or infectious disease (such as tuberculosis) was exponentially higher than it is today; the Industrial Revolution in Great Britain was more than 60 years in the making, and this resulted in part, with large numbers of families moving into urban areas, thus making the opportunity for spreading contagious disease all the more possible. Further, Snow’s proto-epidemiological search and investigation during the late summer of 1854 occurred nearly a century before antibiotics were developed and used to treat infection and deadly maladies. To be sure, Snow demonstrated something very important with respect to his map of Soho: spatial thinking skills can enable us to grapple with adverse, and oftentimes life-threatening situations of utmost criticality. By identifying cases with hash marks on a map of Soho, Snow was able to identify the cause of the upsurge of cholera cases in the Soho vicinity—a well with a water pump serving the community tainted water with potentially deadly cholera bacteria.
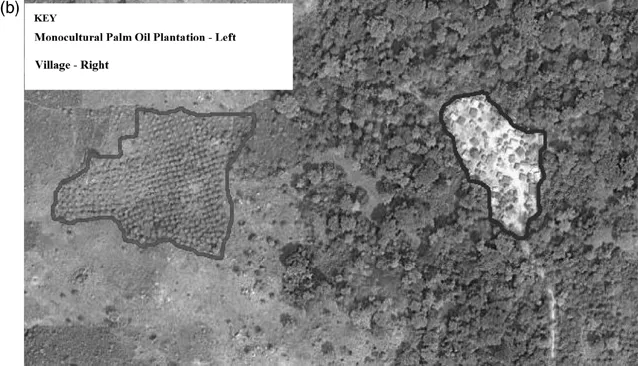
In comparison to Snow’s diagram, Figure 1.3b is a GIS image of the border between Sierra Leone and Guinea near the west coast of Africa. This image is a magnificent example of a twenty-first-century version of Snow’s epidemiological map of 1854. Given that fruit bats were determined to be one of the main lines of transmission of the Ebola virus, and that this species of bat depends primarily on dense tropical forest and wetlands environments for survival, it was critical for physicians and Red Cross personnel to hone in on specific locations where fruit bats congregate. While dense rain forests are key for fruit bat survival, fruit bats carrying the Ebola virus were found primarily where they can get sources of nourishment—namely, oil palm trees. The GIS snapshot in Figure 1.3b shows buildings and other human dwellings outlined on the right and oil palm cultivations outlined on the left. The need for spatial thinking with respect to this image is unequivocal—the groves where the fruit bats congregate are within yards from communities with homes and other buildings where people do business and other forms of transactions in everyday life. Clearly, distance and proximity—both spatially charged concepts—impact the extent to which Ebola infection may occur.
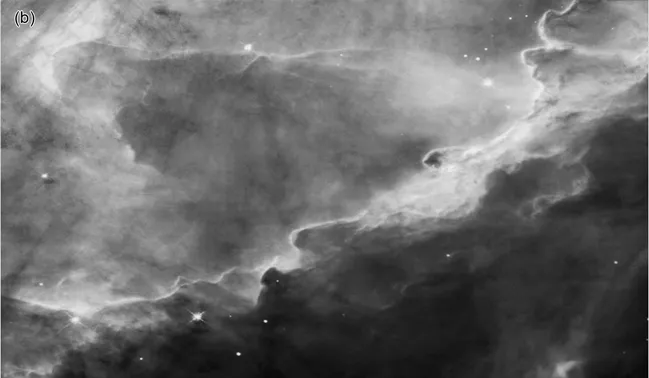
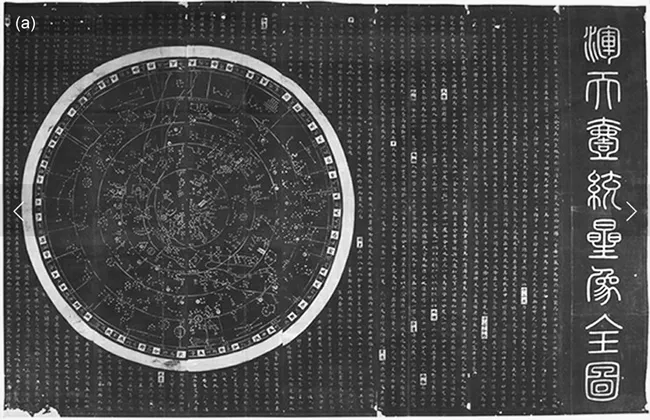
What about the answer to the first question with respect to Figures 1.4a? As we indicated previously (p. 4), the Suzhou Star Map rubbing is a representation of constellations that led to changes in the Chinese calendar system during the late twelfth century. Astronomers during the twelfth century completed the star map that connects concepts of space with time. Through the innovations of this star map, the Chinese calendrical system influenced later astronomical representations, such as that of the Tenmon Bunya no Zu that was conceived and worked out by Harumi Shibukawa on the orders of the Japanese shogunate with the intention of revising the lunisolar calendar in the late seventeenth century. Figure 1.4a differs from all previous examples in that the Suzhou Star Map rubbing is a representation of space on a macro level—as it represents galaxies and related features of the universe. So, too, does the picture in Figure 1.4b. Consisting of hydrogen gas and other elements, Swan (Omega) Nebula, a Hubble image, shows a swath of space that is approximately 5000 to 6000 light years from earth and some 15 light years in diameter. As we have indicated earlier, Messier 17 is only a section of the entire Swan Nebula—a star formation hotbed (no pun intended). Both Figures 1.4a and 1.4b demonstrate space on a massive scale. Space on the macro level—“outer space”—is often the way in which many individuals refer to space. At the very least, it is the way in which most people use the term in the everyday context.
We move on to the second question posed: what relationship exists, if any, among all diagrams in each of the four pairs? In answering this question, we refer to the work of Urie Bronfenbrenner and his contributions to ecology as it relates to human development as we consider the notion of ecological space (2009). Just as understanding the earth from an ecological perspective—such as the categories of species, population, community, ecosystem, and biosphere—can shed light on the nature of environmental change, so, too, is it possible to reflect on human development and cognition in general and space or spatial thinking in specific through the lens of an ecological framework. Thus, the relationship of each of the eight depictions in Figures 1.1 through 1.4 is evident when considering spatial cognition from an ecological perspective. From an ecological standpoint, then, Figures 1.1a and 1.1b clearly exemplify what specialists in spatial cognition would refer to in ecological contexts as a micro system in spatial thought. Next come Figures 1.2a and 1.2b—what we believe falls into the category of the meso-system of spatiality. This is because our encounters with Geoboards and (spatial) test questions are physically experienced in our everyday lives; they are things we can describe clearly in that they are in proportion within our visual field, and, therefore, can be utilized and discussed through sight and touch. Figures 1.3a and 1.3b, we argue, fall into the category of the exo-system of spatial thought. This has to do with the fact that these depictions—the physical map of Soho in London and the bird’s-eye view of an Ebola-affected region—cannot be touched or viewed in the same manner as a book or a Geoboard because their referents are relatively larger spaces than items in our local environments that can be compared to our personal contexts; at the same time, they are not large to the extent that we are unable to fathom where something is located within a map or in a GIS. In contrast, Figures 1.4a and 1.4b are difficult to conceptualize within our local contexts. Again, this has to do with our contexts in comparison with those of stellar environments—those that are almost entirely bereft of personal perspective.
To explain this phenomenon, we refer to books, periodicals, or the Internet as examples. Go to nearly any news website on the Internet. You will undoubtedly encounter a story about a newly found exoplanet, a Goldilocks exoplanet (one that may be suitable for life), up-to-date research on the oldest galaxy to date, a sighting of a black hole. The list goes on. To be sure, newly discovered events, not only in our solar system, but just about anywhere in the universe, are posted as news stories at a near-exponential rate. The point is that we’re so far away from these events that it is next to impossible to identify an actual and real representation of objects in space at this level, what, in ecological terms, would be referred to as the macro system, or astronomical space. The depictions of newly discovered phenomena that are parsecs from Earth are virtually always depicted in a way that is described by astrophysicists. We often see new exoplanets, for example, with captions that read: “An artist’s depiction of Planet X” and the like. So, in reconceptualizing the meaning of spatial thinking, it is important to consider the ecological model as a starting point in research and analysis of space and spatial thinking. All systems within the ecological framework are important in a variety of ways that affect our lives—from the spatial relations at the atomic level to those of the Goldilocks exoplanet that may be many parsecs from Earth.
So, based on the answers to the two initial questions that begin this chapter, we can safely argue that spatial thinking is universal—literally. However, our analysis of these diagrams and photographs leads us to a time-honored enigma: what is spatial thinking? Restated, what is space?
The Importance of Spatial Thinking
In the second edition of Geography for Life: National Geography Standards, the National Council for Geographic Education (NCGE) revised its standards to emphasize the need to include spatial thinking ...