![]()
Part I
General concepts
![]()
LEARNING OBJECTIVES
▪ What a GIS is and how it can be used
▪ Basic spatial concepts
▪ What map projections are and why they matter
▪ What a spatial data model is and how it is important
Background
The use of Geographic Information Systems, or GIS, is now longstanding within geography. Over the past few years, its usefulness and popularity have begun to diffuse into other social sciences, where both practitioners and students are increasingly expected to produce and consume information that presumes familiarity with GIS analysis. In many fields, such as health or crime, spatial analysis and GIS-based research have become almost ubiquitous. The teaching of GIS methods, however, often remains firmly lodged inside geography departments, and instruction can be stubbornly divorced from applied topics and research questions. This textbook is not aimed at those proposing to become GIS developers and specialists, as those individuals will require much more in the way of theory and background information. Rather, its purpose is to help those who are experts in a variety of social science disciplines or topical areas to become conversant and capable with common GIS tools and concepts. Its entire point is to enable researchers to use GIS in a range of disciplinary settings.
Geographers often argue that geography is what geographers do. That is, research becomes geographical when performed by someone in that field. This tautology aside, a common thread that runs through most spatial research is a belief in the importance of place and space. How this importance is captured varies – both qualitative and quantitative approaches are common. In this book, we emphasise the utility of a GIS for quantitative analysis, with an emphasis on learning tools and methods in an applied setting. We take frequently used GIS tools and show their applicability across the social sciences and then come at the subject from the other direction, highlighting areas of research and how spatial questions and GIS analysis can contribute to new knowledge creation. Thus, the meat of this book commences with Chapter 2 and continues in the subsequent chapters in Part I, which delve into the range of tools most likely to be of interest to social scientists. Part II of the textbook explores specific GIS applications.
The goals of this first chapter are twofold: first, to show how GIS tools open new windows of opportunity and knowledge and, second, to cover important basic concepts that are fundamental to working with spatial data, as well as structuring and answering spatial questions in the social sciences. In our combined teaching experience, we have found that, naturally, everyone wants the fun part: the analytical tools. Many of the roadblocks encountered in research or in reliability of results, however, stem from inadequate attention to the very basics. So, read on!
Before jumping into the applications – the valuable and interesting things a GIS can do – and the fundamental but important material – the basics of working with spatial data – we should be clear what we mean when we refer to a GIS. A GIS, is a combination of many components, the most prominent of which is the actual piece of software being used for analysis. The GIS software, examples of which are Environmental Systems Research Institute’s (ESRI) ArcGIS, open-source QGIS or MapInfo, is used to make maps but also for what is called ‘spatial analysis’. Spatial analysis takes many forms, from computation of spatial variables, such as the distance from households to the nearest hospital, to measurements of area or density calculations, to more sophisticated statistical and/or mathematical modelling. A GIS can also be used purely for data management and organisation, in particular if one is collecting a variety of types of data on a particular place and wants to be able to query the data based on location.
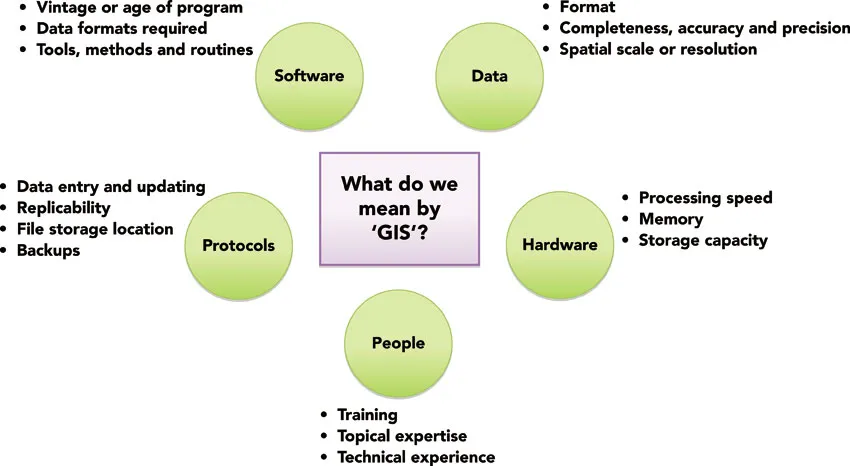
In conversations regarding methods, one will hear phrases such as, ‘I used GIS to create this map’ or ‘I learned GIS last year’ as if the entirety of GIS is contained within a software application. In actuality, the software is but one piece of the GIS puzzle (Figure 1.1). Other key elements are the data being used, the training of the individual working with the software and the computer hardware itself. It might seem as if these are minor points. However, one quickly learns that the quality of the analytical output is only as good as the input data and the training of the user. More importantly, because spatial data can be complex and because analytical procedures tend to be computationally intensive, the processing speed and memory of the computer can matter enormously. As with any technical or methodological subfield, the skills of software developers, GIScientists and computer scientists are indispensable. These are the academics and practitioners who not only implement the algorithms and tools underpinning the software applications, but also develop the very methods and theories that applied researchers depend upon in their own research. Although many researchers use GIS, the majority engages with it at the levels of data, tools and software. For some specialists, though, especially in geography or computer science, GIS is an object of research in itself. Issues to do with development and implementation of methods, as well as more abstract but important questions, such as how space is measured or data organised, all fall increasingly under the rubric of Geographic Information Science, or GISci.
Figure 1.1 Key components of a GIS
The capabilities we take for granted in a GIS are the culmination of several disparate advances – in technology, data collection and availability, and in accumulated knowledge. Learning GIS, especially the sort of applied GIS skills emphasised in this text, is much easier than it was even ten years ago. To some extent this is due to the ubiquity today of geographical information: most of us have been exposed to spatial thinking through Google Maps or navigational software in cars and feel moderately comfortable with maps and spatial information. The accessibility of GIS and spatial analysis tools for the more casual or inexpert user – what, in essence, makes it possible to learn GIS with a book such as this – is the result of longer trends. However, two stand out in particular. First, the development of faster desktop GIS has further separated GIS from the realm of programming and complex syntax and made it much more user friendly. Most GIS tools can be reached from pull-down menus and straightforward interfaces, which are sophisticated enough for most users. A growing range of GIS tools are increasingly embedded within web-based data visualisation tools, some of which (such as ESRI’s ‘ArcGIS Online’) have increased analytic and data handling functionality.
Second, increases over time in the sheer availability of georeferenced data have made it possible to ask and answer questions that could only have been dreamed of a few decades ago. Some of these data are the outcome of efforts and investment in the collection of baseline geographic data on the part of national governments (e.g. master address files and physical geography characteristics), while non-traditional data collection and remotely sensed data, collectively thought of as ‘big’ data, have also increased in quality and quantity. The result is that the average researcher or student, working alone and without a big budget, can hope to find a great deal of decent data easily and free of cost for many locations in the world. Further examples of this can be found in the practical exercises that accompany this book.
What can a GIS and spatial analysis do?
In the mid-19th century, when population growth in London was far outstripping the capacity of existing infrastructure (and when germ theory was still in its infancy), cholera outbreaks were a frequent phenomenon and response was hampered by lack of understanding regarding the mode of transmission. John Snow, a physician today considered the father of modern epidemiology, conceived of mapping cholera deaths along with the locations of water pumps. This map, seen in Figure 1.2, is often considered one of the first examples of ‘spatial analysis’ and even today highlights advantages of visualising data on a map, as well as considering spatial interconnections between multiple types of information (in this case, cholera deaths and water pumps). The innovation is not so much in the underlying data collection process, although Snow was thorough in interviewing affected households and querying their water collection behaviour – after all, mid-19th-century England was good at collecting statistics. The fact remains, though, that evaluating these data in tabular format, versus on a neighbourhood map, allows very different conclusions. The former tells us the typical age and sex of those affected, for example, while the latter gives a clear picture of the spatial clustering in the illness that existed (these are the black bars lining the streets in the map). The innovation that elevates this figure f...